記得第一次聽到箱形圖,不知道為何,就是會和藏寶圖聯想在一塊。
箱形圖(Box)也稱為盒鬚圖或箱線圖,用一個方形的箱子顯示數據的分佈情形,通常在箱子外的資料會被稱為離群值,可以表達數據分散的情況。
箱形圖的中心線上下及箱型上下邊界可以表達數據中的最大值、最小值、中位數、Q3及Q1四分位數。
R語言中,我們可以用ggpolt2套件中的函數geom_boxplot()
http://docs.ggplot2.org/0.9.3.1/geom_boxplot.html
我們在資料夾MyR新增一支Day18.R
這邊我們使用R內建的資料集ToothGrowth,他是一個實驗維生素C劑量和牙齒生長長度關係的數據紀錄。
在Day18.R中輸入程式碼
#使用長度先畫箱形圖
ggplot(ToothGrowth, aes(x = 0, y = len)) + geom_boxplot()
執行結果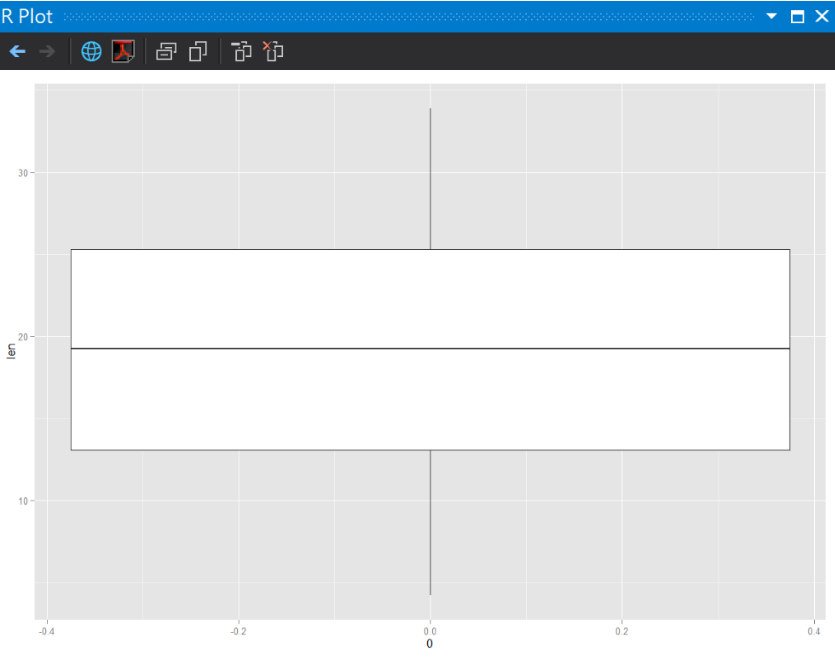
但沒辦法看出給藥方式的差異。
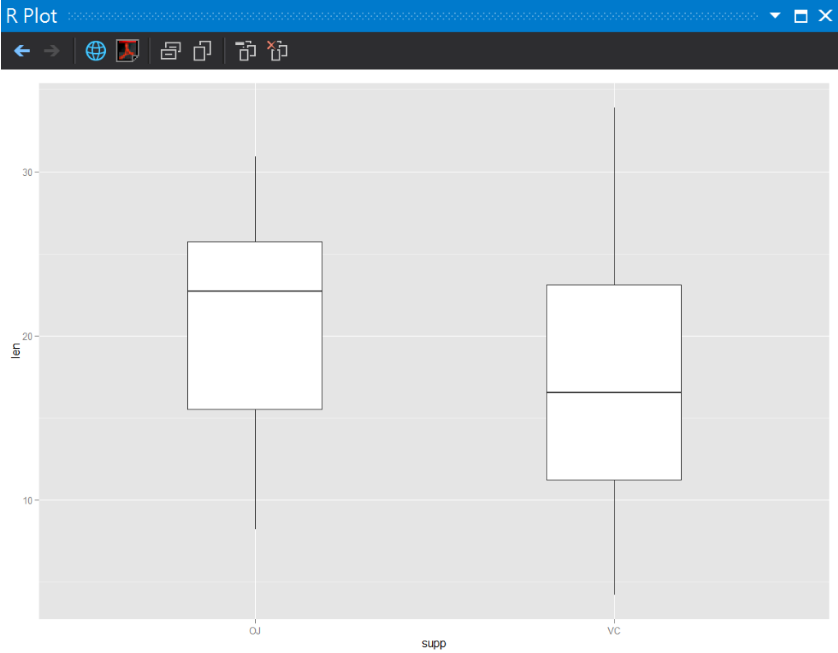
試試看將X軸改為Supp(給藥方式)
在Day18.R中輸入程式碼
#X軸改用兩種給藥方式(柳橙汁(OG)或維生素C(VC))
ggplot(ToothGrowth, aes(x = supp, y = len)) + geom_boxplot(width = .5)
執行結果
在Day18.R中輸入程式碼
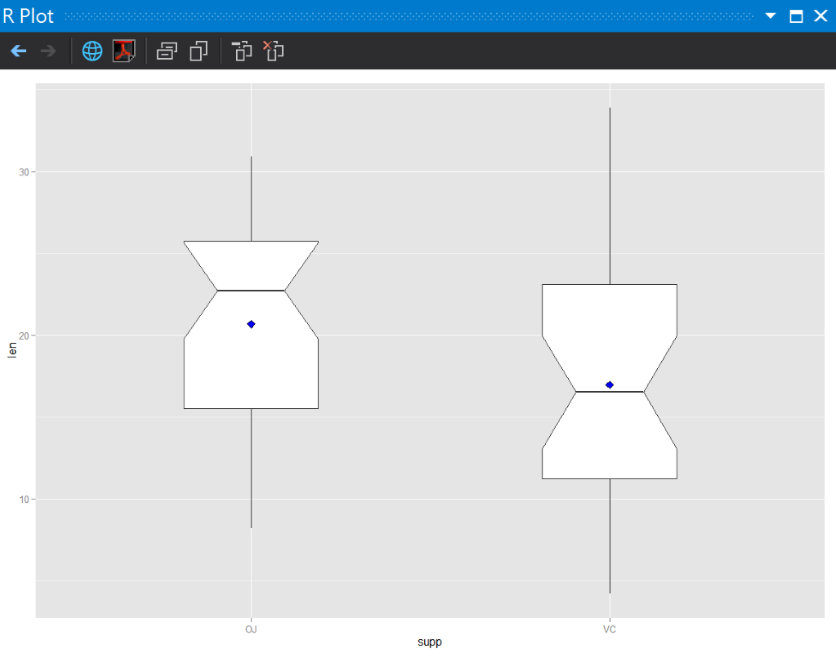
#加上缺口效果和平均數的點
ggplot(ToothGrowth, aes(x = supp, y = len)) + geom_boxplot(width = .5, notch = TRUE) +
stat_summary(fun.y = "mean", geom = "point", shape = 23, size = 3, fill = "blue")
執行結果
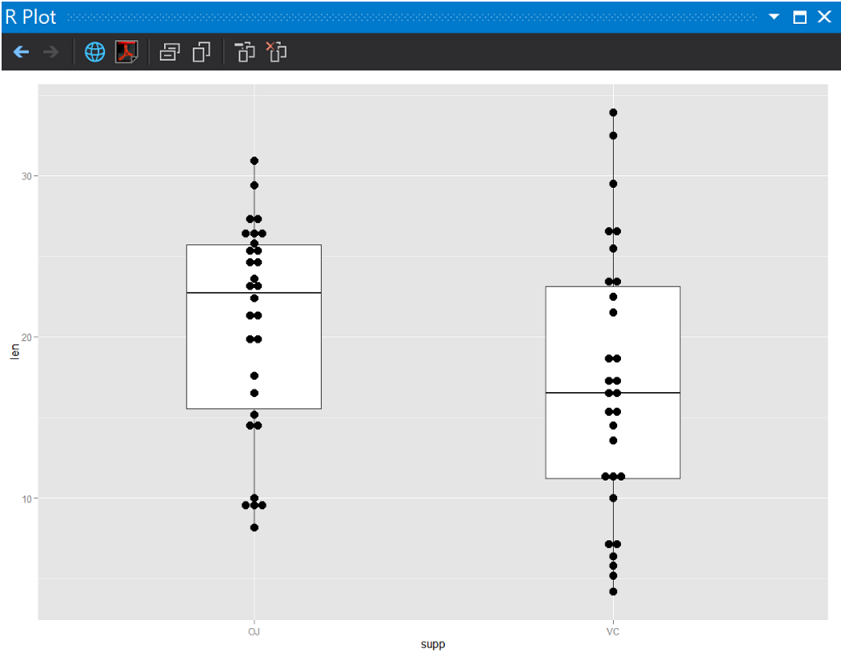
在Day18.R中輸入程式碼
#X加上點圖(DotPlot)
ggplot(ToothGrowth, aes(x = supp, y = len)) + geom_boxplot(width = .5) +
geom_dotplot(binaxis = "y", binwidth = .5, stackdir = "center")
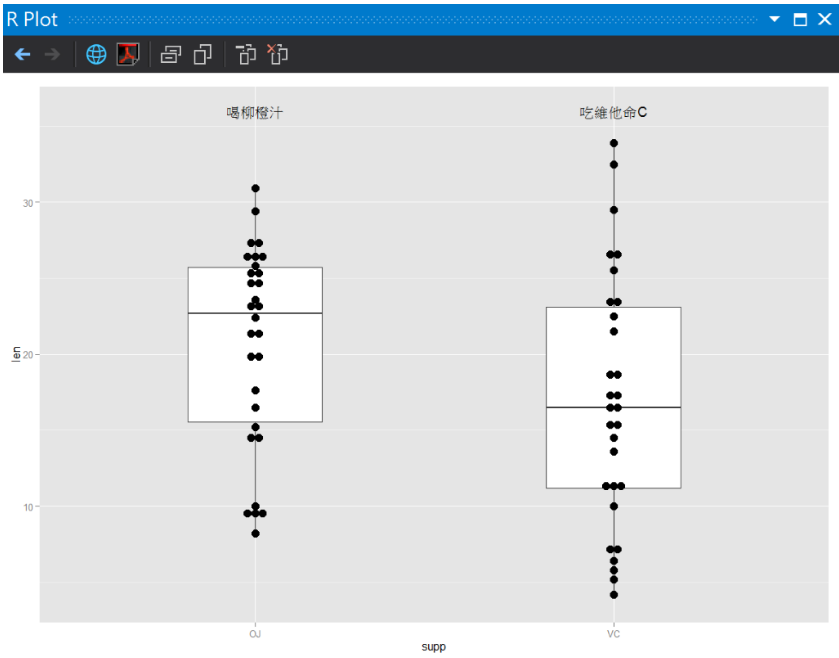
在Day18.R中輸入程式碼
#加上註釋(Text Annotations)
ggplot(ToothGrowth, aes(x = supp, y = len)) + geom_boxplot(width = .5) +
geom_dotplot(binaxis = "y", binwidth = .5, stackdir = "center") +
annotate("text", x = 1, y = 36, label = "喝柳橙汁") +
annotate("text", x = 2, y = 36, label = "吃維他命C")
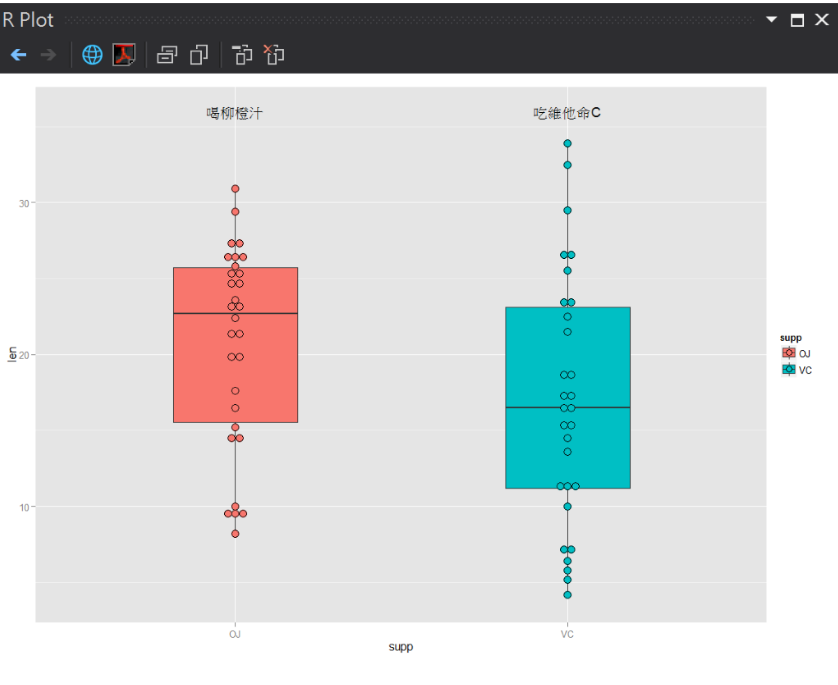
在Day18.R中輸入程式碼
#boxplot再加上顏色(default color)
ggplot(ToothGrowth, aes(x = supp, y = len, fill = supp)) + geom_boxplot(width = .5) +
geom_dotplot(binaxis = "y", binwidth = .5, stackdir = "center") +
annotate("text", x = 1, y = 36, label = "喝柳橙汁") +
annotate("text", x = 2, y = 36, label = "吃維他命C")
今天是台北馬拉松(taipei marathon)要跑初馬(初次馬拉松),就像鐵人賽第一次參加,希望自己可以堅持到最後,可以平順完成比賽。

2016.12.17攝於象山,台北
http://docs.ggplot2.org/0.9.3.1/geom_boxplot.html
R Graphics cookbook
出發!