接下來為了讓大家有實際操作的機會,我將以kaggle中Titanic練習資料集作為示範,詳細的內容請自行詳閱比賽中的資料介紹頁面。另外,由於後續的文章應該多少也會使用到這個資料集,所以非常建議大家可以參與到這個比賽之中,然後把資料集下載下來練習,對大家學習也會有幫助。
這篇文章會用到的code都放在這個檔案中了,請大家斟酌觀看下載。
在此之前,請大家先把相關套件安裝並import。
import pandas as pd

import matplotlib.pyplot as plt
from mpl_toolkits.mplot3d import Axes3D
from sklearn.decomposition import PCA

import seaborn as sns
sns.set()
%matplotlib inline

import Counter
並從將從kaggle下載下來的資料檔(train.csv)讀進去,以利接下來跟著操作。
df = pd.read_csv("train.csv") #建立一個DataFrame。如果大家的train.csv不是跟執行的pythony在同一個資夾,請寄格更改路徑位置。
df.head(N) # N如果不填,則回傳頭5行

df.info()

你會發現,有一些欄位的non-null值不是891,這事後就要想辦處理null值,至於處理方式在後面「資料前處理」的章節,會做詳細介紹。順帶一題重要觀念,載python中內建的null值稱為None,但是在numpy集pandas中的預設null值稱為NaN,兩個最大的差別在於...
A = df['Cabin'][0]           #pandas中索引的方法後面會說,你只要知道這一個欄位是NaN就可以了
print(A)                     #nan
print(A == None)             #False
print(pd.isnull(A))          #True
print(pd.notnull(A))         #Fasle

A = np.nan
print(A)                     #nan
print(A == None)             #False
print(pd.isnull(A))          #True
print(pd.notnull(A))         #Fasle

A = None
print(A)                     #None
print(A == None)             #True
print(pd.isnull(A))          #True
print(pd.notnull(A))         #Fasle
總之,你會發現
B_Cabins = []
for c in df['Cabin']: #把Cabin這個Column的值出來跑回圈
    print(type(c)) #印出Cabin的type
    if c.startswith('B'): #這一行如果c的type不是str的話,就會跳錯誤訊息,因為startswith是str的方法。
        B_Cabins.append(c)
B_Cabins

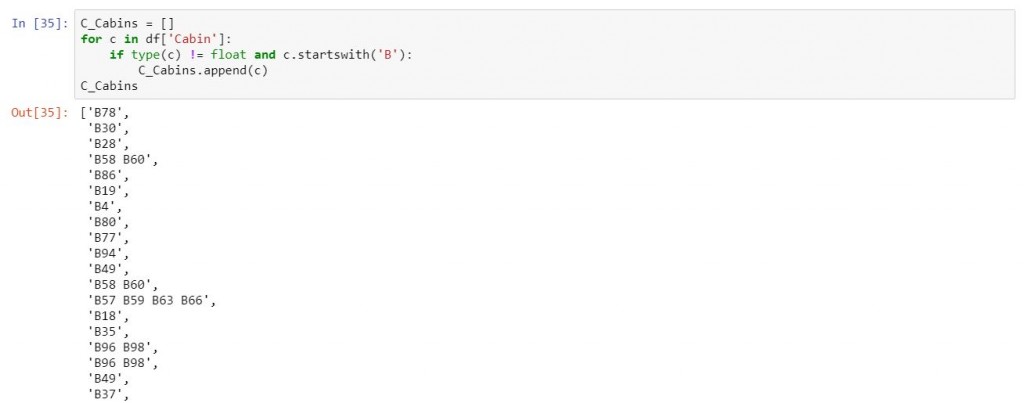
總之,請大家記熟這個錯誤訊息哈。以下示範如何暫時解決這個問題。不過你總是要面對Null值的,這只是一個暫時逃避方式,如果大家想簡單一點處理,也可以先使用fillna()這個方法。
C_Cabins = []
for c in df['Cabin']:
#     if type(c) != float and c.startswith('B'):
    if pd.notnull(c) and c.startswith('B'):
        C_Cabins.append(c)
C_Cabins

B_Cabins = []
for c in df['Cabin']:
#     if type(c) != float and c.startswith('B'):
    if pd.notnull(c) and c.startswith('B'):  #假設我加上一個條件,把type(c)!=float可以把NaN濾掉,不過這樣也會把真實的float值濾掉,所以比較好的做法還是pd.isnull(c)。
        B_Cabins.append(c)
B_Cabins

df.describe()

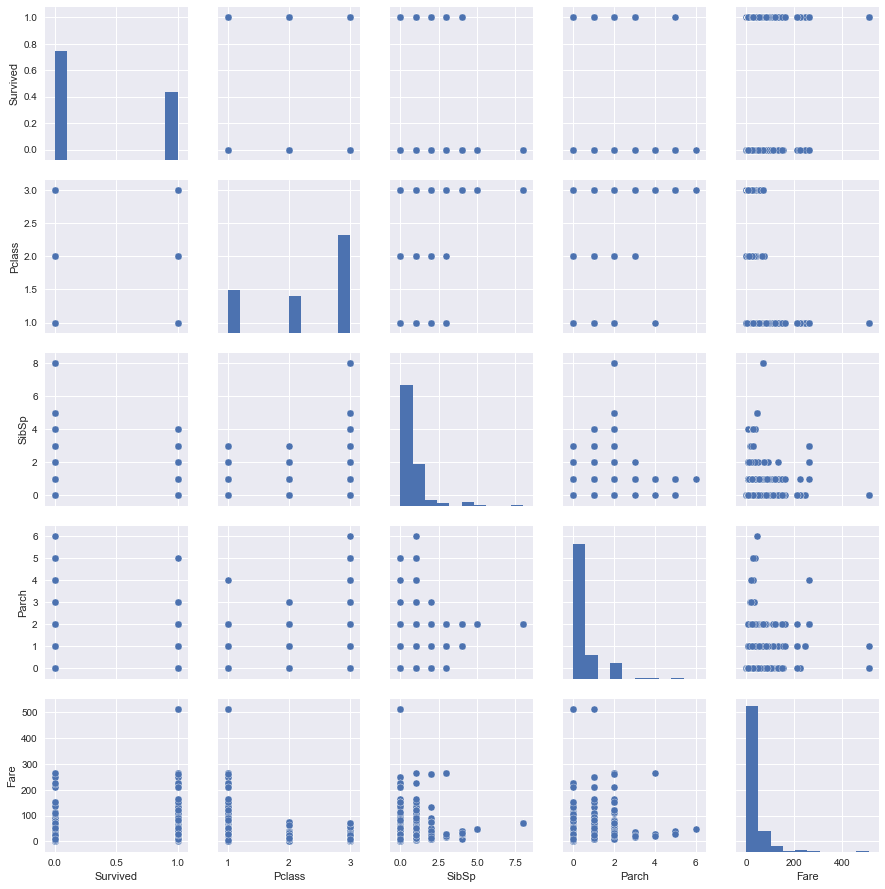
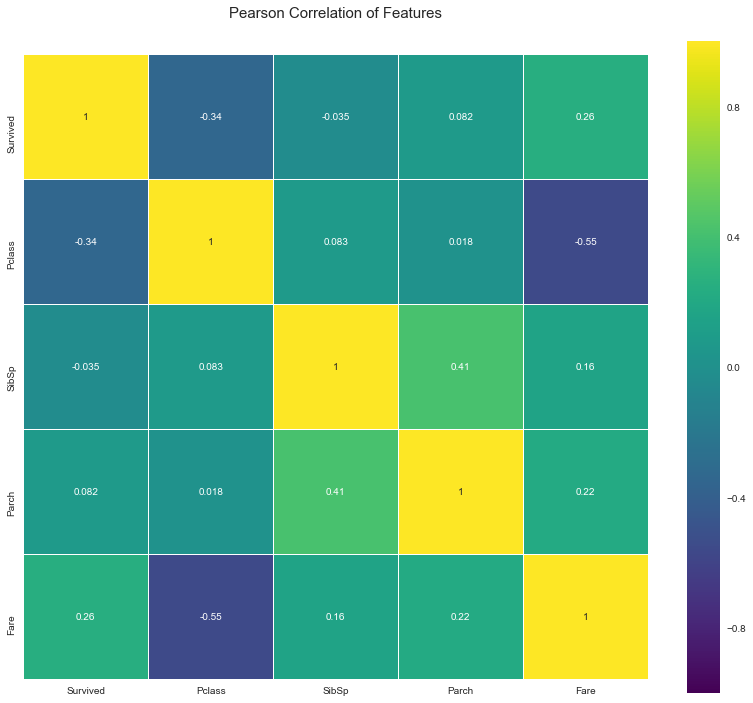
由於這些資料不太能接受有NaN,所以我暫時先只放沒有NaN的欄位進去。
sns.pairplot(df[['Survived', 'Pclass', 'SibSp', 'Parch', 'Fare']])

colormap = plt.cm.viridis
plt.figure(figsize=(14,12))
plt.title('Pearson Correlation of Features', y=1.05, size=15)
sns.heatmap(df[['Survived', 'Pclass', 'SibSp', 'Parch', 'Fare']].astype(float).corr(),linewidths=0.1,vmax=1.0, square=True, cmap=colormap, linecolor='white', annot=True)

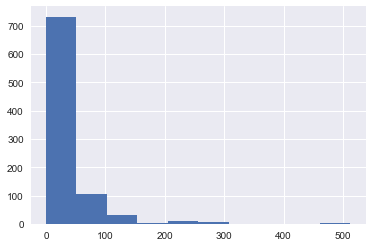
可以將某一欄位的所有資料plt.hist()方法中,便可以畫出直方圖。不過在上面的pairplot已經可以找到這樣的圖,只是pairplot繪畫得比較久,如果你只關心某一變數的分布狀況,則可以使用這個方法。
plt.hist(df['Fare']) #histogram是直方圖的意思
plt.show()

#查看總長度
len(df)

#查看有哪些columns
df.columns #記得不要加括號

#查看有哪些indices
df.index

明天將繼續講解Pandas的索引功能,也是這個套件中最迷人的地方,請大家拭目以待....
