今天我們將使用上篇文章中所建立的模型,來進行訓練,並且查看結果。
y_label=tf.placeholder("float",[None,10])
因為輸入的圖片數量不確定,所以第1維度設定為None,而因為第2個維度對應到0~9共10個數字所以設定為10。
loss=tf.reduce_mean(tf.nn.softmax_cross_entropy_with_logits(logits=y,labels=y_label))
使用(https://www.tensorflow.org/api_docs/python/tf/nn/softmax_cross_entropy_with_logits)
這個方法來當作損失函數。
optimizer = tf.train.AdamOptimizer(learning_rate=0.001).minimize(loss)
使用
(https://www.tensorflow.org/api_docs/python/tf/train/AdamOptimizer)
來當作優化方法。
correct_prediction = tf.equal(tf.argmax(y_label , 1), tf.argmax(y,1))

accuracy = tf.reduce_mean(tf.cast(correct_prediction , "float"))
第1行:比對兩個矩陣內資料是否相同。
第2行:將上列預測正確結果平均。
train = 15
batchSize= 110
total= 500
loss_list=[];epoch_list=[];accuracy_list=[]
starttime=time()
sess=tf.Session()
sess.run(tf.global_variables_initializer())

for epoch in range(train):
    for i in range(total):
        batch_x,batch_y=mnist.train.next_batch(batchSize)
        sess.run(optimizer,feed_dict={x:batch_x , y_label:batch_y})
    loss1,acc=sess.run([loss,accuracy], feed_dict={x:mnist.validation.images, y_label:mnist.validation.labels})
    epoch_list.append(epoch)
    loss_list.append(loss1)
    accuracy_list.append(acc)
    print("Train Epoch:",'%02d' % (epoch+1),"loss=","{:.9f}".format(loss1)," accuracy=",acc)
duration = time()-starttime
print("train finished takes:",duration)

plt.plot(epoch_list,accuracy_list,label="accuracy")
fig =plt.gcf()
fig.set_size_inches(4,2)
plt.ylim(0.8,1)
plt.ylabel('accuracy')
plt.xlabel('epoch')
plt.legend()
plt.show()
第1行:train為定義訓練周期數。
第2行:batchSize為定義每次筆數。
第3行:訓練總筆數為55000,所以當每次為110筆的情況下,要進行500次。
第4行:初始化訓練周期,誤差,準確機率等等。
第5行:計算執行時間。
第6~7行:定義會談以及初始化。
第9~12行:開始進行訓練,訓練周期為15次每一周期為500批次。
第13行:使用驗證資料計算準確機率以及誤差。
第14~17行:顯示訓練結果,並且存入list。
第18~19行:計算並顯示訓練時間。
第21~28行:畫出準確機率圖表
def plot_images_labels(images,labels,prediction,idx,num=10):
    fig=plt.gcf()
    fig.set_size_inches(12,14)
    if num>25:
        num=25
    for i in range(0,num):
        ax=plt.subplot(5,5,1+i)
        ax.imshow(np.reshape(images[idx],(28,28)), cmap='binary')
        title="label=" +str(np.argmax(labels[idx]))
        if len(prediction)>0:
            title+=",predict="+str(prediction[idx])
        ax.set_title(title,fontsize=10)
        ax.set_xticks([])
        ax.set_yticks([])
        idx=idx+1
    plt.show
第1行:傳入數字影像,真實值,預測結果,開始顯示資料的開頭,要顯示的筆數等資料。
第2~3行:設定顯示圖形的大小。
第4~5行:當顯示筆數參數大於25設定為25。
第6~15行:執行for迴圈,畫出num個數字。
第16行:開始畫圖。
prediction=sess.run(tf.argmax(y,1),feed_dict={x:mnist.test.images})

plot_images_labels(mnist.test.images,mnist.test.labels,prediction,0)
第1行:執行預測。
第3行:顯示前10筆預測結果
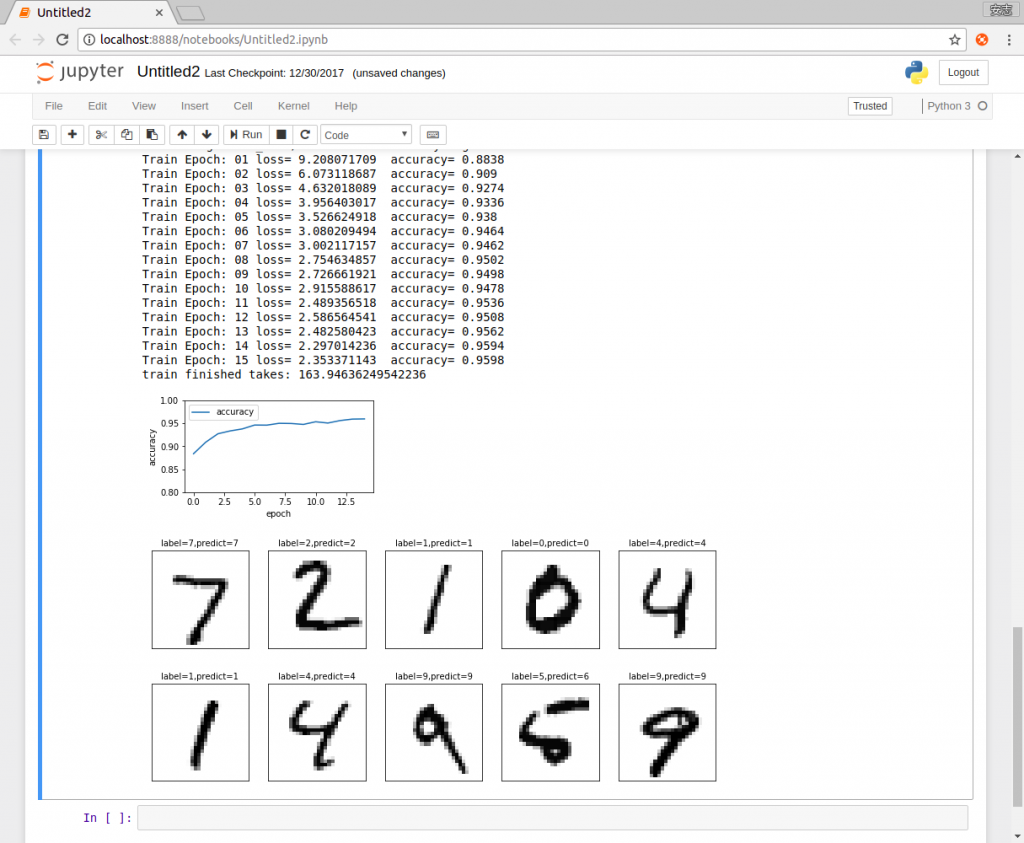
我們使用多層感知器來進行手寫數字的辨識,再進行15次周期隱藏層神經元1000的情況下,準確率大概是0.95左右,再下篇開始會加入CNN來增加預測的準確機率。