今天是鐵人的第26天,主要介紹爬取財報的資料,和財報的基本分析。
需要的套件requests,如果沒有這個套件用以下的語法新增
pip install requests
介紹底下的圖表之前先預先載入需要的套件
# basic
import numpy as np
import pandas as pd

# get data
import pandas_datareader as pdr

# visual
import matplotlib.pyplot as plt
%matplotlib inline
import seaborn as sns

#requests
import requests
網站:公開資訊觀測站
爬取的內容:
def remove_td(column):
    remove_one = column.split('<')
    remove_two = remove_one[0].split('>')
    return remove_two[1].replace(",", "")

def translate_dataFrame(response):
     # 拆解內容
    table_array = response.split('<table')
    tr_array = table_array[1].split('<tr')

    # 拆解td
    data = []
    index = []
    column = []
    for i in range(len(tr_array)):
        td_array = tr_array[i].split('<td')
        if(len(td_array)>1):
            code = remove_td(td_array[1])
            name = remove_td(td_array[2])
            revenue  = remove_td(td_array[3])
            profitRatio = remove_td(td_array[4])
            profitMargin = remove_td(td_array[5])
            preTaxIncomeMargin = remove_td(td_array[6])
            afterTaxIncomeMargin = remove_td(td_array[7])
            if(type(code) == float):
                data.append([code, revenue, profitRatio, profitMargin, preTaxIncomeMargin, afterTaxIncomeMargin])
                index.append(name)
            if( i == 1 ):
                column.append(code)
                column.append(revenue)
                column.append(profitRatio)
                column.append(profitMargin)
                column.append(preTaxIncomeMargin)
                column.append(afterTaxIncomeMargin)

    return pd.DataFrame(data=data, index=index, columns=column)
def financial_statement(year, season):

    if year >= 1000:
        year -= 1911

    url = 'http://mops.twse.com.tw/mops/web/ajax_t163sb06'
    form_data = {
        'encodeURIComponent':1,
        'step':1,
        'firstin':1,
        'off':1,
        'TYPEK':'sii',
        'year': year,
        'season': season,
    }

    response = requests.post(url,form_data)
    response.encoding = 'utf8'

    df = translate_dataFrame(response.text)
    return df

stock = financial_statement(107,2)
stock = stock.astype(float)
抓取到的資料如下圖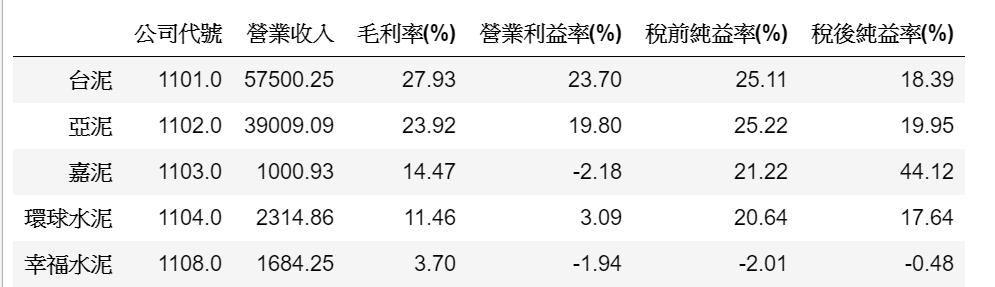
抓取完資料之後要來做簡單幾個例子的分析,示範如下
stock.loc['一零四']
# 輸出結果
公司代號          3130
營業收入        782.06
毛利率(%)       89.89
營業利益率(%)     21.27
稅前純益率(%)     22.96
稅後純益率(%)     18.55
Name: 一零四, dtype: object
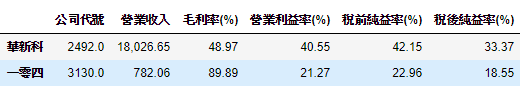
stock.loc[['華新科','一零四']]
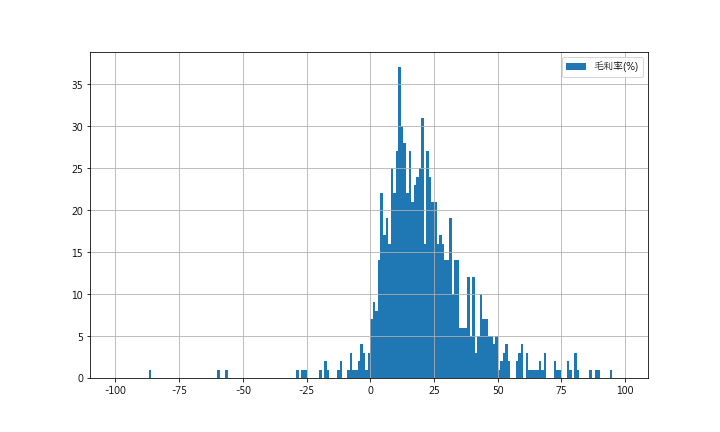
plt.rcParams['axes.unicode_minus']=False
fig = plt.figure(figsize=(10, 6))
stock['毛利率(%)'].hist(bins=range(-100,100) , label="毛利率(%)")
plt.legend()
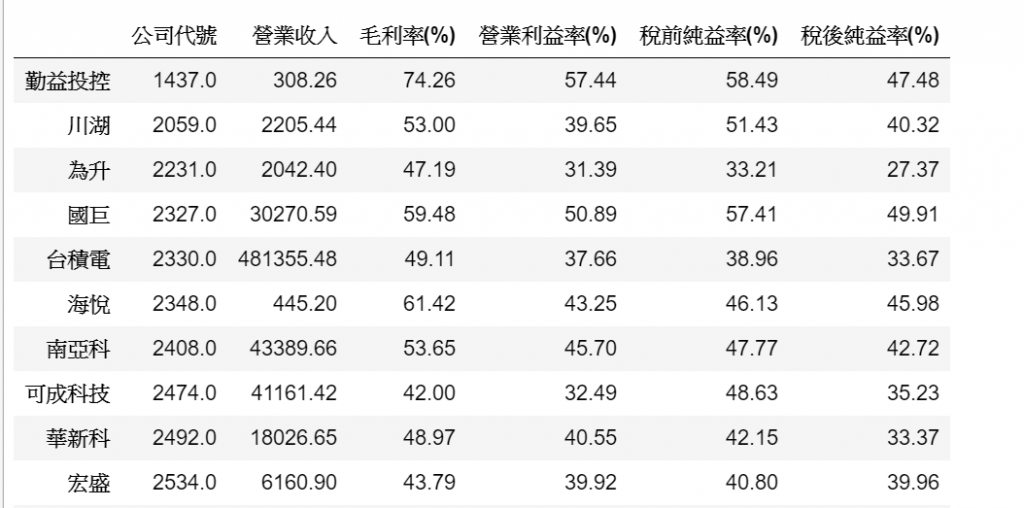
cond1 = stock['毛利率(%)'] > 30
cond2 = stock['營業利益率(%)'] > 30
stock[cond1 & cond2]
今天學習了如何抓取財報的資料,並且轉成DataFrame,再用DataFrame來設條件選取想要的股票。這是一個非常基礎的示範。各位讀者也可以設定自己想要的條件來抓取股票
出現錯誤:
ndexError Traceback (most recent call last)
df = translate_dataFrame(response.text)
tr_array = table_array[1].split('tr')
IndexError: list index out of range
抓取資料的程式,這邊的URL為空,可能換過位置
def financial_statement(year, season):

    if year >= 1000:
        year -= 1911

    url = 'http://mops.twse.com.tw/mops/web/ajax_t163sb06'