iT邦幫忙

2019 iT 邦幫忙鐵人賽

DAY 21
0
Software Development

30天學演算法和資料結構系列 第 21

[資料結構] 圖 (Graph)

  • 分享至 

  • xImage
  •  

圖 (Graph),在資料結構上指的是點和點之間的關聯的東西,並不是數學定義上的兩點成一線,三點成一面的那種圖。一張圖由數條邊(Edge)和數個點(Vertex)所構成,點和點之間可用邊相連,表示這兩個點之間有所關聯。當然,兩個點之間可以有很多個邊,代表很多關係,又或者是一個點可以與很多個點相連接。

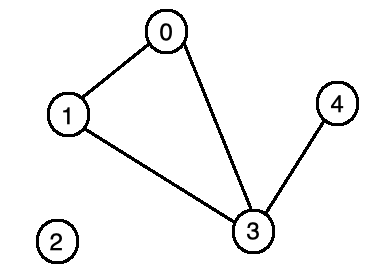
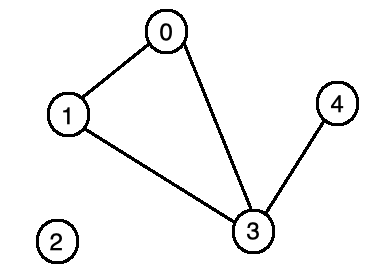
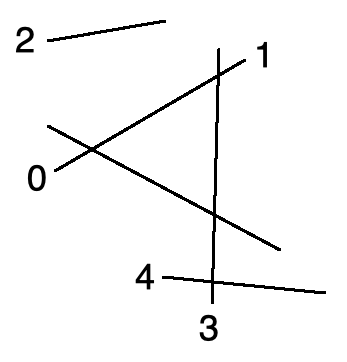
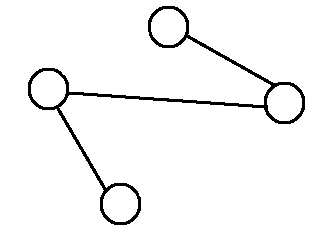
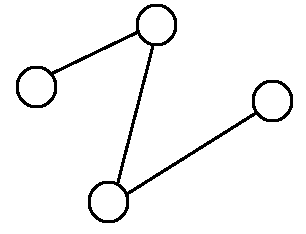
1. 同構 (Isomorphism / Isomorphic)

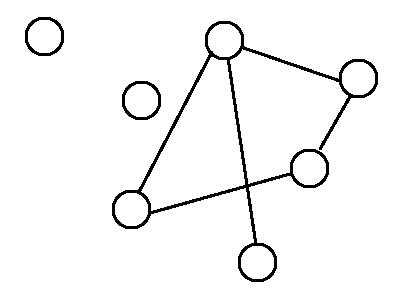
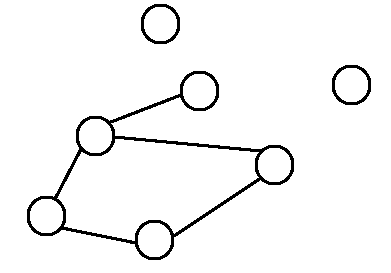
指的是兩張圖的連接方式一模一樣的,而圖上的可以任意移動,不論直的彎的皆可。
https://ithelp.ithome.com.tw/upload/images/20181106/20111557ehSfTOvFWI.pnghttps://ithelp.ithome.com.tw/upload/images/20181106/20111557yite5frHZt.png

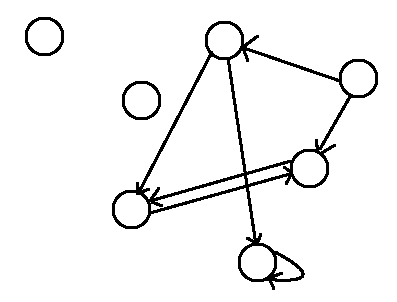
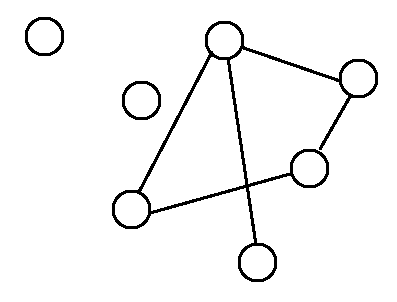
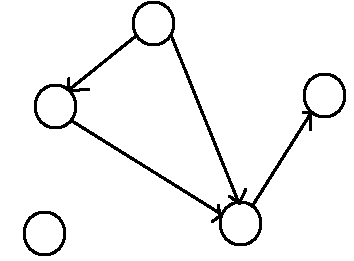
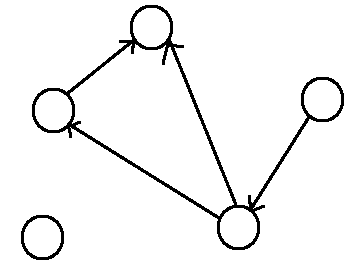
2. 有向圖 & 無向圖

有向圖,邊有方向性,表示兩點之間為單向關係
https://ithelp.ithome.com.tw/upload/images/20181106/20111557kT1DbTHGkO.png
無向圖,邊無方向性,表示兩點之間為雙向關係
https://ithelp.ithome.com.tw/upload/images/20181106/20111557CicTNiToFT.png

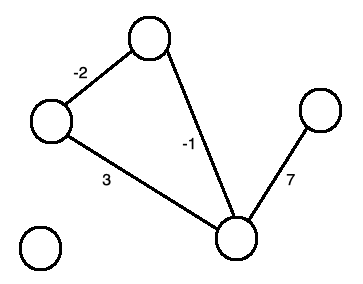
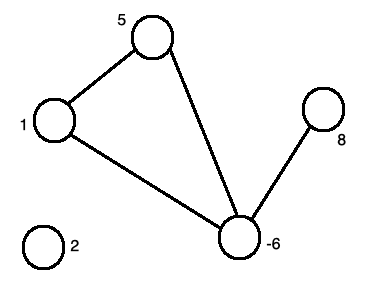
3. 權重

邊加上權重,代表兩點之間的關係
https://ithelp.ithome.com.tw/upload/images/20181106/20111557QgOXz9iC6E.png
點加上權狀,代表狀態
https://ithelp.ithome.com.tw/upload/images/20181106/20111557UUONEtcHsk.png

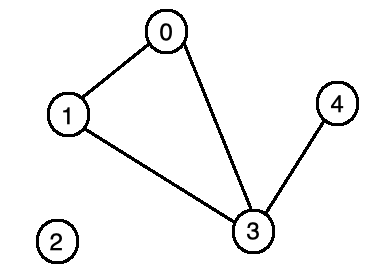
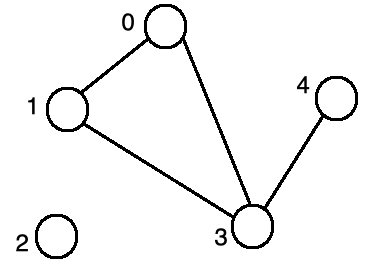
4. 名稱 or 代號

點可以有名稱或者代號
https://ithelp.ithome.com.tw/upload/images/20181106/20111557UBrLhRARnK.pnghttps://ithelp.ithome.com.tw/upload/images/20181106/201115571Js119nxnx.png

5. 圖的資料結構

圖是由點和邊所組成,為了方便人了解,所以視覺化。但實際上在電腦中的儲存方式卻有很多不同的方法。可以有陣列或矩陣的方式儲存。

  • Eagle List

將圖用陣列的方式,記錄點與點之間的邊
https://ithelp.ithome.com.tw/upload/images/20181106/20111557jq5Hvo6CHf.png

0 0 1 3
1 3 3 4
  • Adjacency Matrix

把一張圖上的點依序標示編號,然後建立一個矩陣,來記錄連接資訊。方陣中的每一個元素都代表著某兩點的連接資訊。
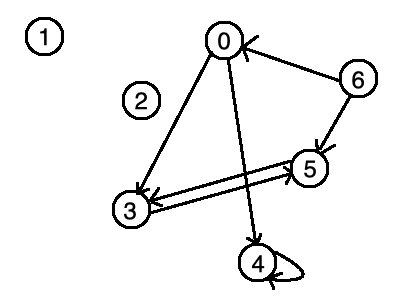
https://ithelp.ithome.com.tw/upload/images/20181106/20111557nIv7F2Oecl.png

  0 1 2 3 4 5 6
0 0 0 0 1 1 0 0
1 0 0 0 0 0 0 0
2 0 0 0 0 0 0 0
3 0 0 0 0 0 1 0
4 0 0 0 0 1 0 0
5 0 0 0 1 0 0 0
6 1 0 0 0 0 1 0
舉例來說,0 分別有一條連向 3 和 4 的邊,所以第 0 列的 3、4 行為 1。
  • Adjacency Lists

在每一個點後方,串連所有相鄰有連接的點
無相圖
https://ithelp.ithome.com.tw/upload/images/20181106/20111557xdVkHnIrxg.png
0 [1, 3]
1 [0, 3]
2
3 [0, 1, 4]
4 [3]
有向圖
https://ithelp.ithome.com.tw/upload/images/20181106/20111557nIv7F2Oecl.png
0 [3, 4]
1
2
3 [5]
4 [4]
5 [3]
6 [0, 5]

圖的遍歷 (Graph Traversal)

  • 深度優先搜尋 Depth-first Search

  • 廣度優先搜尋 Breadth-first Search

(之後會另外討論~)

特殊圖

  • Intersection Graph

若兩個物件有交集關係(非空集合),就可以表示成圖。
https://ithelp.ithome.com.tw/upload/images/20181106/20111557KA5uuTwtcl.pnghttps://ithelp.ithome.com.tw/upload/images/20181106/201115571QlqkitUsn.png
又或者是:
0 = {a, b, c}
1 = {a, d}
2 = {e}
3 = {b, d, f}
4 = {f}
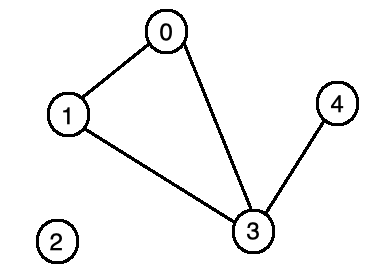
https://ithelp.ithome.com.tw/upload/images/20181106/201115571QlqkitUsn.png

  • Dependency Graph

是將各個物件所仰賴或依賴的對象關係表示成圖。
A > C ; E < C
B > A ; C < B
D
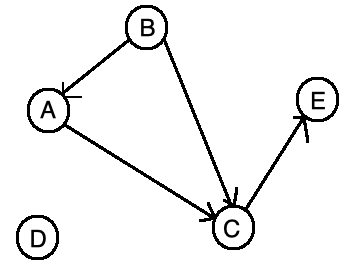
https://ithelp.ithome.com.tw/upload/images/20181106/20111557hM3Nwbc02c.png

  • 子圖 Subgraph / 父圖 Supergraph

一張圖,刪除一些點、一些邊,得到的圖稱作「子圖」。原圖(沒有刪除)、空圖(完全刪除),也算是「子圖」。
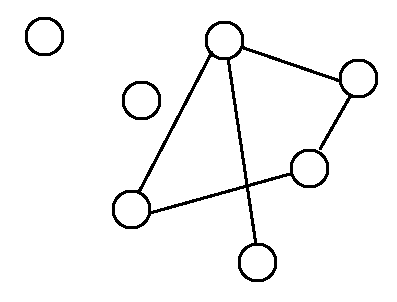
https://ithelp.ithome.com.tw/upload/images/20181106/20111557VlwsKbsaP4.png
一張圖,增加一些點、一些邊,得到的圖稱作「父圖」。原圖(沒有增加)也算是「父圖」。
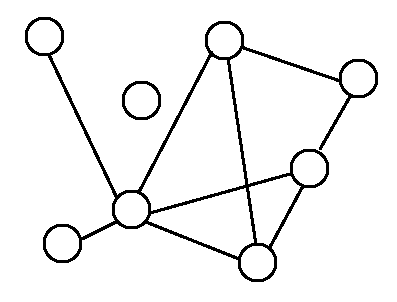
https://ithelp.ithome.com.tw/upload/images/20181106/201115575IbGYudL9m.png
(子圖和父圖兩者是相對關係)

  • 補圖 Complement Graph ( Complement )

兩點之間,有邊變沒邊,沒邊變有邊。
https://ithelp.ithome.com.tw/upload/images/20181106/20111557x67dm1cgI5.pnghttps://ithelp.ithome.com.tw/upload/images/20181106/20111557DNlJre85ca.png

  • 反向圖 Reverse Graph ( Transpose )

有向圖的邊顛倒過來,方向相反。
https://ithelp.ithome.com.tw/upload/images/20181106/20111557mYwjBLssGQ.pnghttps://ithelp.ithome.com.tw/upload/images/20181106/201115577wBCFZlUCP.png

  • Line Graph

一張圖當中,觀察邊與邊關係,相鄰的邊表示成一張圖,稱作「線圖」。
(黑色為原圖,紅色為線圖)
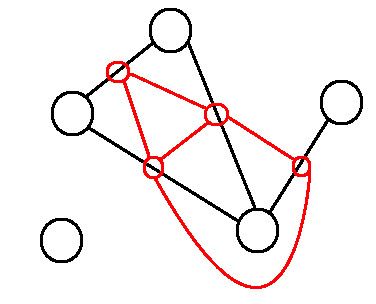
https://ithelp.ithome.com.tw/upload/images/20181106/20111557SvsQO6iGJr.png

  • Dual Graph

一張平面圖當中,觀察面與面關係,共邊的面表示成一張圖,稱作「對偶圖」。
(黑色為原圖,紅色為對偶圖)
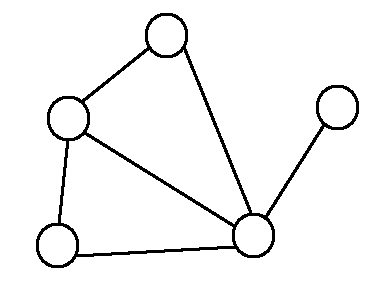
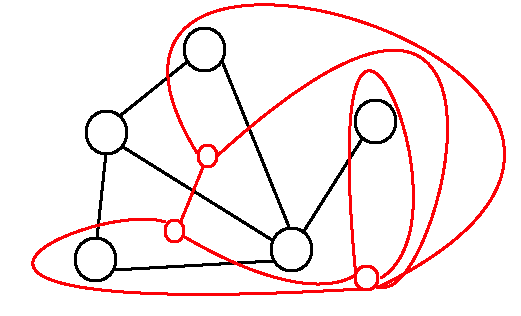
https://ithelp.ithome.com.tw/upload/images/20181106/20111557SLN3zzxWPG.pnghttps://ithelp.ithome.com.tw/upload/images/20181106/20111557G3Cvk9KeRp.png


上一篇
[演算法] 廣度優先搜尋 (Breadth-first Search)
下一篇
[資料結構] 圖的深度優先走訪 (Depth-first Search )
系列文
30天學演算法和資料結構31
圖片
  直播研討會
圖片
{{ item.channelVendor }} {{ item.webinarstarted }} |
{{ formatDate(item.duration) }}
直播中

尚未有邦友留言

立即登入留言