Neural nets
– Pytorch, Tensorflow, Keras...
Linear models
– SVM, logistic regression
– Vowpal Wabbit, FTRL
這邊僅討論 dense neural network, 指的是 fully connected layers.
What framework to use?
– Keras,Lasagne – TensorFlow
– MxNet
– PyTorch
PyTorch 或 Keras <-- 推薦 / Recommended
Neural nets
1. Number of neurons per layer : 在每一層加上神經元, 讓 model 可以學習更複雜的決策疆界, 以及加速 overfit.
2. Number of layers : 在還不確定 model 效果前, 開始先一層一層 64 units 慢慢加, 邊加邊 debug 跟降低 loss.
3. Optimizers
- SGD + momentum --> stochastic gradient descent with momentum, 比較慢但穩, 訓練的模型通常比較好
- Adam/Adadelta/Adagrad/... --> In practice lead to more overfitting, 比較快但要注意易導致 overfitting.
4. Batch size : 建議一剛開始用 32 或 64, 若 underfitting 就增加, 反之則減少.
5. Learning rate : 建議一剛開始用 0.1, 然後嘗試減少後再試, learning rate 跟 batch size 有相關, 作法是以 α 增加 batch size 時, 也可以同時用 α 增加 learning rate.
6. Regularization
- L2/L1 for weights : 早期作法 L1, L2 來正規化, 現在都用 dropout
- Dropout/Dropconnect
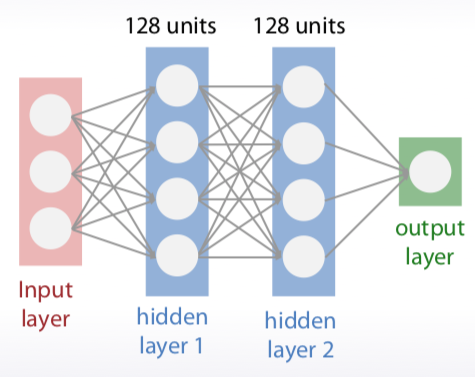
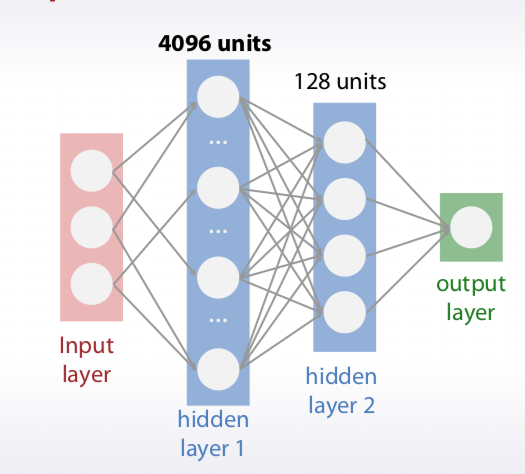
- Static dropconnect : 下圖一的第一層隱藏層 128 units 改成 4096 units(下圖二), 網路變巨大, 所以在比賽中在 input layer 跟第一層隱藏層中間隨機丟掉 99%, 是很有威力的正規化做法.
圖一

圖二

截圖自 Coursera
Linear models
1. Scikit-learn
- SVC/SVR <-- 現在少人用了
. Sklearn wraps libLinear and libSVM : SVM 好用, 不太需要調校
. Compile yourself for multicore support
- LogisticRegression/LinearRegression + regularizers
- SGDClassifier/SGDRegressor <-- 之前 metrics 講過了
2. Vowpal Wabbit :逐行在硬碟讀資料及處理, 不會整包跑, 可用來學習大量資料
- FTRL (flow the regularized leader)
3. Regularization parameter (C, alpha, lambda, ...)
- Start with very small value and increase it.
- SVC starts to work slower as C increases
4. Regularization type
- L1/L2/L1+L2 -- try each
- L1 can be used for feature selection
短髮狄哥的手把手語法練習又來囉, 下列是整套 notebook 搬來的語法跟步驟 : Hyperparameters_tuning_video2_RF_n_estimators
This notebook shows, how to compute RandomForest's accuracy scores for each value of n_estimators without retraining the model. No rocket science involved, but still useful.
Load some data
import sklearn.datasets
from sklearn.model_selection import train_test_split

X, y = sklearn.datasets.load_digits(10,True)
X_train, X_val, y_train, y_val = train_test_split(X, y)
import numpy as np
import matplotlib.pyplot as plt
%matplotlib inline
from sklearn.ensemble import RandomForestClassifier
from sklearn.metrics import accuracy_score
Step 1: first fit a Random Forest to the data. Set n_estimators to a high value.
rf = RandomForestClassifier(n_estimators=500, max_depth=4, n_jobs=-1)
rf.fit(X_train, y_train)

截圖自 Coursera
Step 2: Get predictions for each tree in Random Forest separately.
predictions = []
for tree in rf.estimators_:
    predictions.append(tree.predict_proba(X_val)[None, :])
Step 3: Concatenate the predictions to a tensor of size (number of trees, number of objects, number of classes).
predictions = np.vstack(predictions)
Step 4: Сompute cumulative average of the predictions. That will be a tensor, that will contain predictions of the random forests for each n_estimators.
cum_mean = np.cumsum(predictions, axis=0)/np.arange(1, predictions.shape[0] + 1)[:, None, None]
Step 5: Get accuracy scores for each n_estimators value
scores = []
for pred in cum_mean:
    scores.append(accuracy_score(y_val, np.argmax(pred, axis=1)))
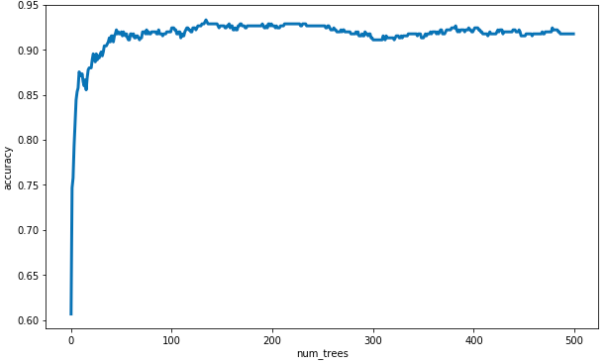
That is it! Plot the resulting scores to obtain similar plot to one that appeared on the slides.
plt.figure(figsize=(10, 6))
plt.plot(scores, linewidth=3)
plt.xlabel('num_trees')
plt.ylabel('accuracy');

截圖自 Coursera


