今天針對前幾日視覺化的結果,來篩選一些符合我需求的房源。
Today we will filter out some listings that fit my need based on the visualizations we did in the past few days.
# 載入所需套件 import the packages we need
import pandas as pd
import numpy as np
import matplotlib.pyplot as plt
import seaborn as sns
import plotly as py

import warnings # 忽略警告訊息
warnings.filterwarnings("ignore")
Read in the file
drop = pd.read_csv('drop.csv') # 讀入昨天存的檔案來分析 read in the file we created yesterday
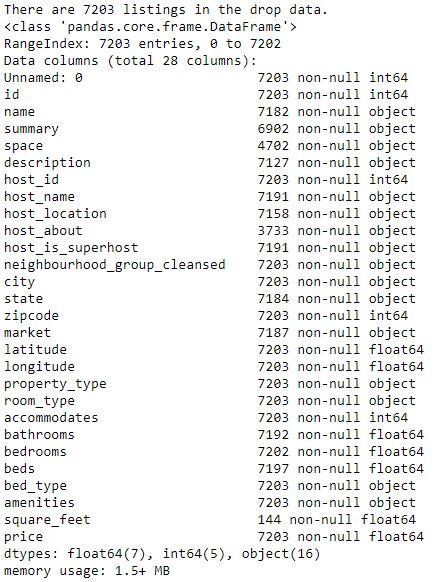
print('There are', drop.id.nunique(), 'listings in the drop data.')
drop.info() # 查看資料細節 the info of data
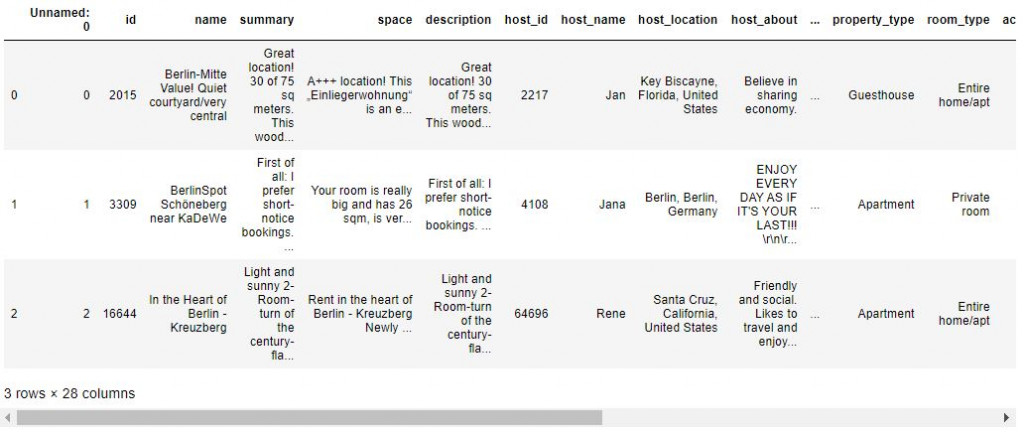
drop.head(3) # 叫出前三筆資料看看 print out the top three rows of data
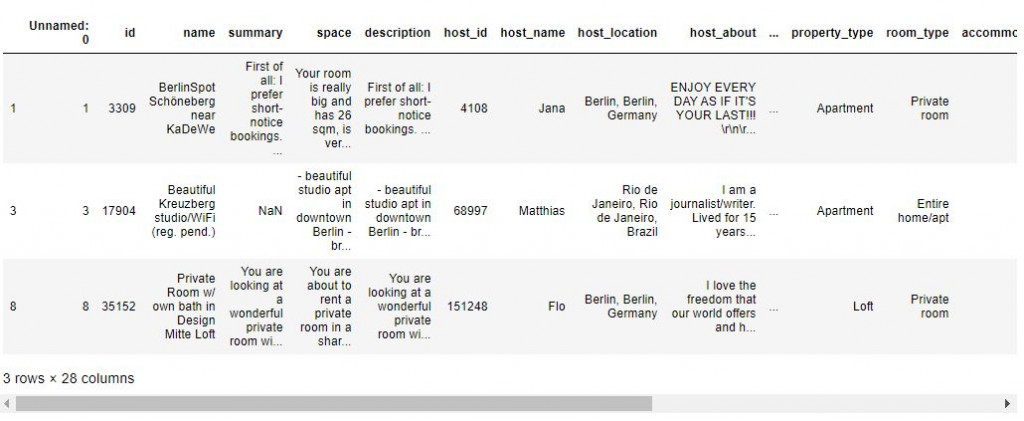
I only need one bed. And I prefer real bed.
drop_beds = drop.loc[(drop.beds<2)&(drop.beds>0)]
drop_beds.head(3)
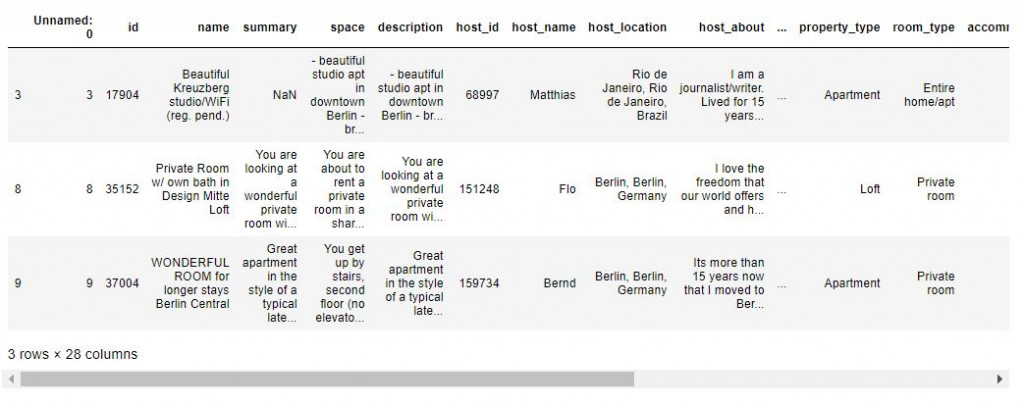
real_bed = drop_beds["bed_type"] == 'Real Bed'
one_real_bed = drop_beds[real_bed]
one_real_bed.head(3)
Bathroom needed, and I want a super host.
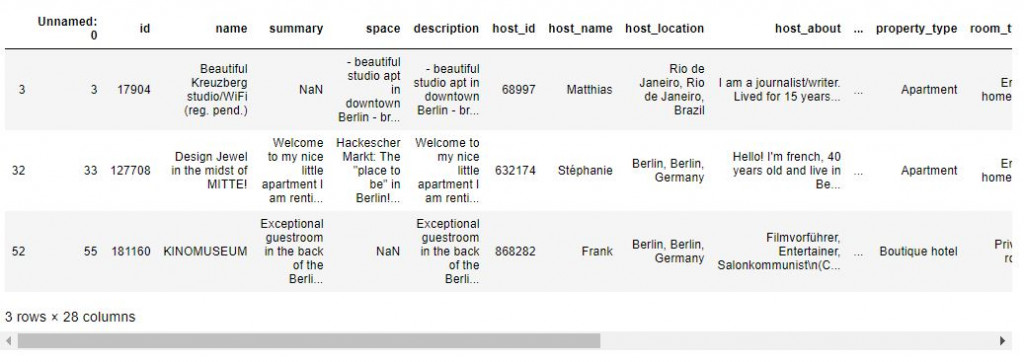
one_bathroom_super = one_real_bed.loc[(one_real_bed.bathrooms>=1)&(one_real_bed.host_is_superhost=='t')]
one_bathroom_super.head(3)
Only house and apartment.
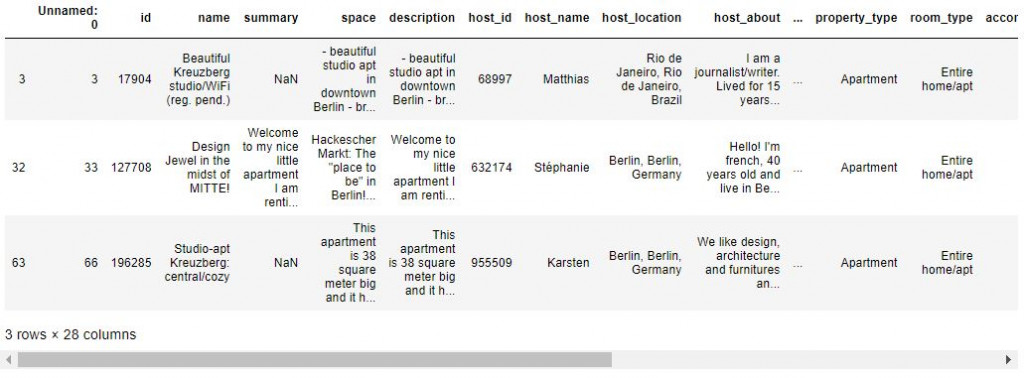
house_apartment = one_bathroom_super.loc[(one_bathroom_super.property_type=='Apartment') | (one_bathroom_super.property_type=='House')]
house_apartment.head(3)
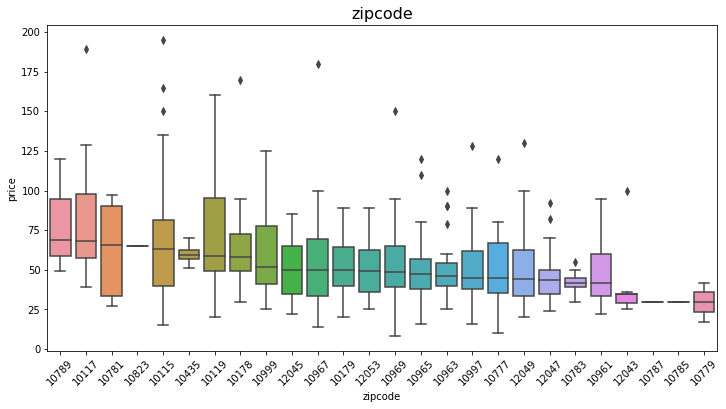
Plot out the price of listings that meet our needs with different zipcodes.
sort_price = house_apartment.groupby('zipcode')['price'].median().sort_values(ascending=False).index

plt.figure(figsize=(12,6))
plt.title('zipcode', fontsize=16)
sns.boxplot(y='price', x='zipcode', data=house_apartment, order=sort_price)
plt.xticks(rotation=45)
Save listing price range from 25 to 100 as a new csv file.
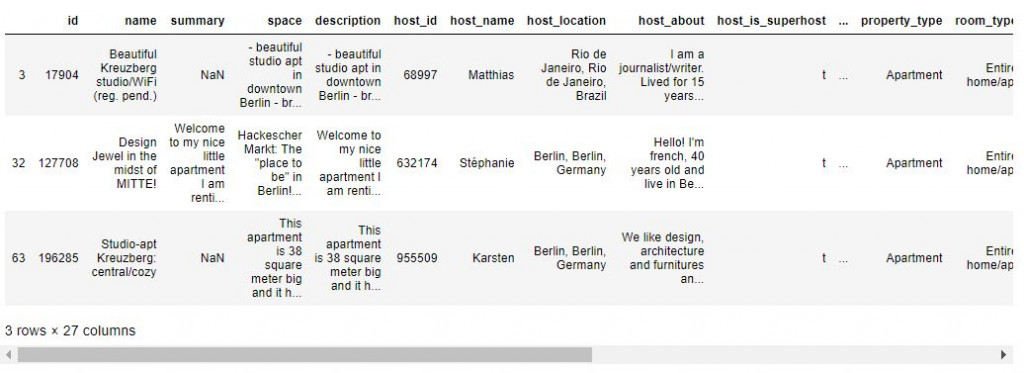
cleaned = house_apartment.loc[(house_apartment.price>=25) & (house_apartment.price<=100)]
cleaned = cleaned.iloc[:, 1:]
cleaned.reset_index(drop=True)
cleaned.head(3)
cleaned.to_csv('cleaned.csv')
本篇程式碼請參考Github。The code is available on Github.
文中若有錯誤還望不吝指正,感激不盡。
Please let me know if there’s any mistake in this article. Thanks for reading.
Reference 參考資料:
[1] Inside Airbnb
[2] 利用Airbnb來更了解居住城市,以臺北為例 Python實作(上)
