今天回歸寫程式,發現寫文章的速度趕不上發文的速度,但我還是會努力把文章生出來的!平常太少寫文章了,文筆不是很好請見諒。
若有用過GIS相關系統的人應該都知道會有一個圖層清單供使用者可以套疊,有些網站圖層清單多的跟什麼似的、有些就是簡單的幾個可供點選,今天我們不求什麼,先求了解多元數據如何載入、如何建立列表供操作與開關,會了基本功能,後面有其他想法就會很容易實現了!
該功能正常的開發流程:
其實所有前後端交互的功能都差不多是這樣,雖然我實際的開發流程是31245678
在這邊先說明我這次只有最基本的開關套疊而已,但我原本設計是要有調整透明度、圖層套疊順序變更等功能,這樣這系列大概要至少3天才會寫得完,所以這部份我就先在這邊pass了。
若有興趣的人可以自己再寫一個slider調整透明度、寫draggable調整區塊的上下,並寫相對應的圖層動作就可以了~
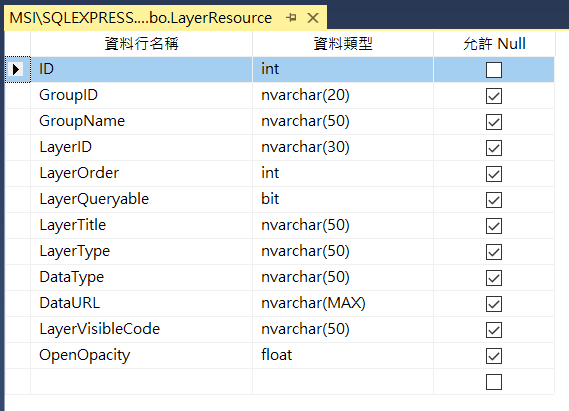
建立圖層列表資料庫 LayerResource
ID:流水碼,自動編號GroupID:圖層的群組IDGroupName:圖層的群組名稱,要與GroupID對應LayerID:該圖層的ID,應為唯一值LayerOrder:圖層在群組內的的排序LayerQueryable: 圖層是否可直接QueryLayerTitle:圖層的名稱LayerType:圖層的載入方式 (ex. Tile、Vector、Heatmap、Cluster等)DataType:圖層的資料格式 (ex. WMS、WFS、WMTS、GeoJSON、KML、GPX等)DataURL:圖層的介接路徑 (為https URL或專案路徑,不含檔案名稱)LayerVisibleCode:圖層的檔案名稱OpenOpacity:預設顯示透明度 (若為0,則表示圖層關閉不顯示在圖面上)
USE [OLDemo]
GO
SET ANSI_NULLS ON
GO
SET QUOTED_IDENTIFIER ON
GO
CREATE TABLE [dbo].[LayerResource](
	[ID] [int] IDENTITY(1,1) NOT NULL,
	[GroupID] [nvarchar](20) NULL,
	[GroupName] [nvarchar](50) NULL,
	[LayerID] [nvarchar](30) NULL,
	[LayerOrder] [int] NULL,
	[LayerQueryable] [bit] NULL,
	[LayerTitle] [nvarchar](50) NULL,
	[LayerType] [nvarchar](50) NULL,
	[DataType] [nvarchar](50) NULL,
	[DataURL] [nvarchar](max) NULL,
	[LayerVisibleCode] [nvarchar](50) NULL,
	[OpenOpacity] [float] NULL
) ON [PRIMARY] TEXTIMAGE_ON [PRIMARY]
GO
因為本篇為教學文章,所以圖層以多樣性為主,讓大家知道不同格式的資料是如何載入的,先不考慮這個圖台的主題,它就只是Demo用的圖台,介接的圖層可依據自己的喜好選擇。
本次資料類型的設計有:
下圖為我使用的所有圖層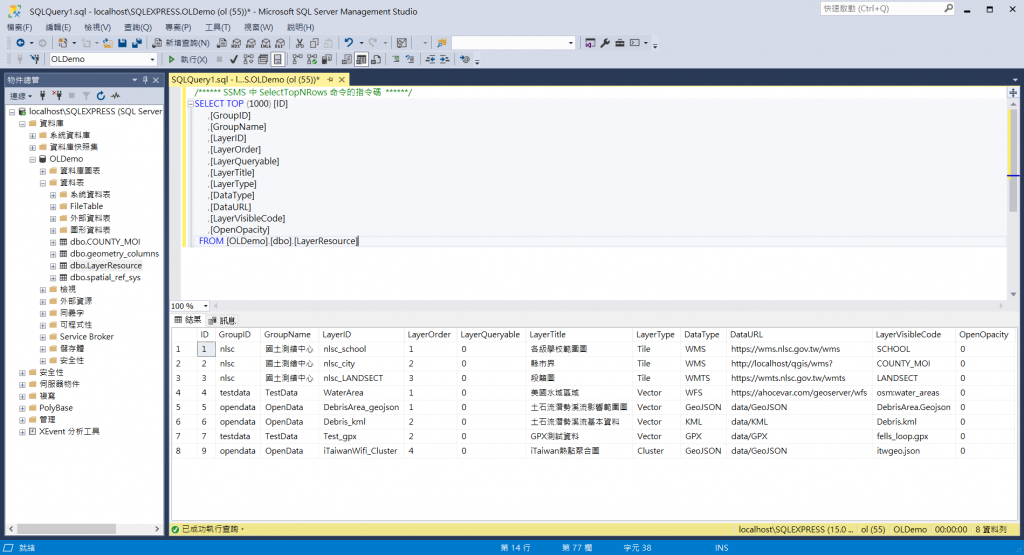
撰寫WebService的部分雖然我在 Day 06. 初訪WebGIS與本機網站架設 已經有提到過了,但應該很多人都忘記了 ,連我剛剛要找我寫在哪都找了一陣子,所以這邊再提一次:
基本原則是前端網頁和後端分離,但是因為新人學習順序的關係,在講解API之前有需要用到DB資料的部分,會採用Web Service的寫法,等到建立完API後,再將功能轉移至API上
至於為什麼不先講API呢?是因為API對新人來說很難快速上手,所以先講解Openlayers的基本功能後,中間再穿插API的建立。
就是這樣,所以我們先來學怎麼建WebService吧!學會了WebService,API也會較容易上手
首先在Web.config內的connectionStrings標籤內新增資料庫連線字串,並將該字串命名為OLDemoDB。
<connectionStrings>
    <add name="OLDemoDB" providerName="System.Data.SqlClient" connectionString="Data Source=localhost\SQLEXPRESS;Initial Catalog=OLDemo; user id=資料庫帳號;password=資料庫密碼;"/>
</connectionStrings>
新增Web服務 WS/LayerService.asmx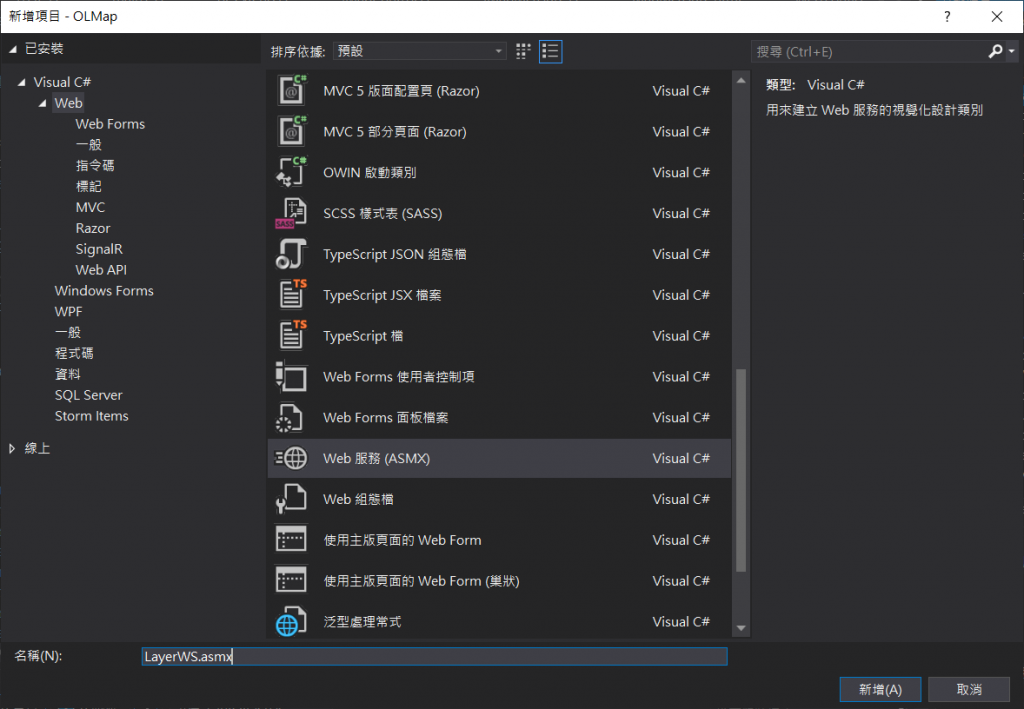
LayerService.asmx裡的內容,以code behind的方式將C#程式碼寫在App_Code/LayerService.cs這個檔案內。
<%@ WebService Language="C#" CodeBehind="~/App_Code/LayerService.cs" Class="LayerService" %>
新增 App_Code/LayerService.cs
LayerResourceList。getLayerResource()的WebService的功能。[OLDemo].[dbo].[LayerResource]撈取資料的SQL Select語法,並以[GroupID], [LayerOrder], [LayerType]這三個值進行排序。using System;
using System.Collections.Generic;
using System.Configuration;
using System.Data.SqlClient;
using System.Linq;
using System.Web;
using System.Web.Script.Serialization;
using System.Web.Script.Services;
using System.Web.Services;
// 1. 建立Class Model
public class LayerResourceList
{
public string ID = "";
public string GroupID = "";
public string GroupName = "";
public string LayerID = "";
public string LayerOrder = "";
public string LayerQueryable = "";
public string LayerTitle = "";
public string LayerType = "";
public string DataType = "";
public string DataURL = "";
public string LayerVisibleCode = "";
public string OpenOpacity = "";
public LayerResourceList(string _ID, string _GroupID, string _GroupName, string _LayerID, string _LayerOrder, string _LayerQueryable, string _LayerTitle, string _LayerType, string _DataType, string _DataURL, string _LayerVisibleCode, string _OpenOpacity)
{
ID = _ID;
GroupID = _GroupID;
GroupName = _GroupName;
LayerID = _LayerID;
LayerOrder = _LayerOrder;
LayerQueryable = _LayerQueryable;
LayerTitle = _LayerTitle;
LayerType = _LayerType;
DataType = _DataType;
DataURL = _DataURL;
LayerVisibleCode = _LayerVisibleCode;
OpenOpacity = _OpenOpacity;
}
public LayerResourceList() { }
}
/// <summary>
/// LayerService 的摘要描述
/// </summary>
[WebService(Namespace = "http://tempuri.org/")]
[WebServiceBinding(ConformsTo = WsiProfiles.BasicProfile1_1)]
// 若要允許使用 ASP.NET AJAX 從指令碼呼叫此 Web 服務,請取消註解下列一行。
[System.Web.Script.Services.ScriptService]
public class LayerService : System.Web.Services.WebService
{
//2. 撰寫getLayerResource()的WebService的功能。
[WebMethod(EnableSession = true)]
[ScriptMethod(ResponseFormat = ResponseFormat.Json)]
public string getLayerResource()
{
// 從config中獲得資料庫OLDemoDB連線字串
SqlConnection conn = new SqlConnection(ConfigurationManager.ConnectionStrings["OLDemoDB"].ConnectionString);
// 3. 從資料表`[OLDemo].[dbo].[LayerResource]`撈取資料的SQL Select語法
SqlCommand cmd = new SqlCommand("SELECT [ID] ,[GroupID] ,[GroupName] ,[LayerID] ,[LayerOrder] ,[LayerQueryable] ,[LayerTitle] ,[LayerType],[DataType] ,[DataURL] ,[LayerVisibleCode] ,[OpenOpacity] FROM [OLDemo].[dbo].[LayerResource] order by [GroupID], [LayerOrder], [LayerType]", conn);
// 建立連線
conn.Open();
// 使用LayerResourceList
List<LayerResourceList> arrList = new List<LayerResourceList>();
SqlDataReader dr = cmd.ExecuteReader();
while (dr.Read())
{
arrList.Add(new LayerResourceList()
{
ID = dr["ID"].ToString(),
GroupID = dr["GroupID"].ToString(),
GroupName = dr["GroupName"].ToString(),
LayerID = dr["LayerID"].ToString(),
LayerOrder = dr["LayerOrder"].ToString(),
LayerQueryable = dr["LayerQueryable"].ToString(),
LayerTitle = dr["LayerTitle"].ToString(),
LayerType = dr["LayerType"].ToString(),
DataType = dr["DataType"].ToString(),
DataURL = dr["DataURL"].ToString(),
LayerVisibleCode = dr["LayerVisibleCode"].ToString(),
OpenOpacity = dr["OpenOpacity"].ToString(),
});
}
// 關閉連線
conn.Close();
dr.Dispose();
cmd.Dispose();
conn.Dispose();
// 4. 將array list 以 JavaScriptSerializer().Serialize序列化為Json格式回傳
return new JavaScriptSerializer().Serialize(arrList);
}
}
下表為擷取本文章所使用的Demo資料列表,服務的部分直接介接現有URL或是自己發的Service;資料的部分則是另外存在資料夾當中。
| ID | LayerTitle | LayerType | DataType | DataURL | LayerVisibleCode |
|---|---|---|---|---|---|
| 1 | 各級學校範圍圖 | Tile | WMS | https://wms.nlsc.gov.tw/wms | SCHOOL |
| 2 | 縣市界 | Tile | WMS | http://localhost/qgis/wms? | COUNTY_MOI |
| 3 | 段籍圖 | Tile | WMTS | https://wmts.nlsc.gov.tw/wmts | LANDSECT |
| 4 | 水域區域 | Vector | WFS | https://ahocevar.com/geoserver/wfs | osm:water_areas |
| 5 | 土石流潛勢溪流影響範圍圖 | Vector | GeoJSON | data/GeoJSON | DebrisArea.Geojson |
| 6 | 土石流潛勢溪流基本資料 | Vector | KML | data/KML | Debris.kml |
| 7 | GPX測試資料 | Vector | GPX | data/GPX | fells_loop.gpx |
| 8 | iTaiwan熱點熱區圖 | Heatmap | GeoJSON | data/GeoJSON | itwgeo.json |
| 9 | iTaiwan熱點聚合圖 | Cluster | GeoJSON | data/GeoJSON | itwgeo.json |
提供本次Demo用的資料供下載,並存在相對應的資料夾內:
5:data/GeoJSON/DebrisArea.Geojson
8 & 9:data/GeoJSON/itwgeo.json
6:data/KML/Debris.kml
7:data/GPX/fells_loop.gpx
在IIS或是Web.config內新增MIME類型,讓網頁讀得到該類型的文件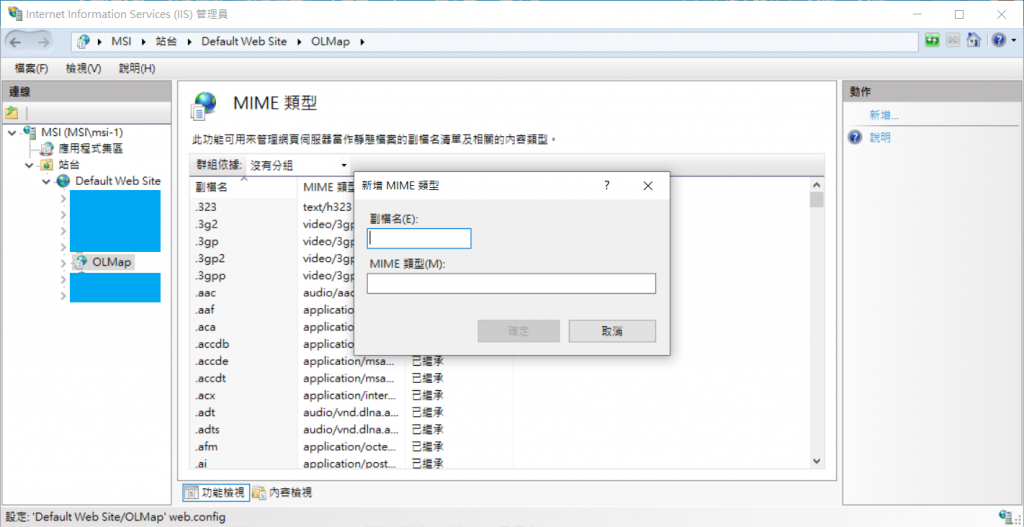
常見的MIME列表可參考:Common MIME types
在此專案下,新增以下MIME列表:
.json:application/json
.geojson:application/geo+json
.kml:application/vnd.google-earth.kml+xml
.gpx:application/gpx+xml
資料的部分就都已經準備好了,接下來就要開始寫程式了
首先先新增一個TOC.html的頁面,並引用jTOC.js的javascript檔案。
<!DOCTYPE html>
<html>
<head>
    <meta charset="utf-8" />
    <title></title>
    <style>
    </style>
</head>
<body>
    <h2>圖層列表</h2>
    <div>
        <div class="ui info small message"><i class="angle double down icon"></i>請勾選下方圖層列表進行圖資套疊</div>
        <div class="ui segment">
            <div class="ui relaxed divided list" id="layerlist">
            </div>
        </div>
    </div>
    <script type="text/javascript" src="map_module/widget/AdvanceTool/jTOC.js"></script>
    <script>
        toc.initTOCLayer();
    </script>
</body>
</html>
新增本頁面css
#layerlist {
    font-family: 'Microsoft JhengHei';
}

    #layerlist .header {
        font-family: 'Microsoft JhengHei';
        font-size: 16px;
        cursor: initial;
    }

    #layerlist .checkbox {
        float: left;
    }

    #layerlist div.description {
        font-size: 10px;
        float: left;
    }

    #layerlist img.layerBtns {
        float: right;
        cursor: pointer;
        /*display: none;*/
    }

    #layerlist .content {
        height: 32px;
    }
先將會常用到的變數加到主頁面載入的js,init.js內
var TOCArray = [];
var config_WSLayerResource = "WS/LayerService.asmx"; // 圖層的WebService服務
由前述可看到最後呼叫了toc.initTOCLayer(),這種寫法跟之前的基本系列寫法不同是因為我後面都會採用閉包的方式進行程式碼的撰寫。
說明如下:
var toc = function () {
    // 全部相關程式碼會寫在這邊

    return {
        // 這邊是要對外使用的function
        initTOCLayer: initTOCLayer,
        toggleTocLayer: toggleTocLayer,
        zoomTocLayer: zoomTocLayer
    };
}();
var一個全域變數叫toc,該全域變數裡面包含了很多的區域變數,只要將需要對外的函式寫在return內,而對外的function寫法為:變數.函式名,如toc.initTOCLayer()、toc.toggleTocLayer()、toc.zoomTocLayer()。
接下來我要講的部分都可以寫在相關程式碼區塊內,包進去。
首先,先建立這次會用到的所有點線面的樣式,讓樣式有一致性
var image = new ol.style.Circle({
    radius: 5,
    fill: null,
    stroke: new ol.style.Stroke({ color: 'red', width: 1 })
});

var styles = {
    'Point': [
        new ol.style.Style({
            image: image
        })
    ],
    'LineString': [
        new ol.style.Style({
            stroke: new ol.style.Stroke({
                color: 'green',
                width: 1
            })
        })
    ],
    'MultiLineString': [
        new ol.style.Style({
            stroke: new ol.style.Stroke({
                color: 'green',
                width: 1
            })
        })
    ],
    'MultiPoint': [
        new ol.style.Style({
            image: image
        })
    ],
    'MultiPolygon': [
        new ol.style.Style({
            stroke: new ol.style.Stroke({
                color: 'yellow',
                width: 1
            }),
            fill: new ol.style.Fill({
                color: 'rgba(255, 255, 0, 0.1)'
            })
        })
    ],
    'Polygon': [
        new ol.style.Style({
            stroke: new ol.style.Stroke({
                color: 'blue',
                lineDash: [4],
                width: 3
            }),
            fill: new ol.style.Fill({
                color: 'rgba(0, 0, 255, 0.1)'
            })
        })
    ],
    'GeometryCollection': [
        new ol.style.Style({
            stroke: new ol.style.Stroke({
                color: 'magenta',
                width: 2
            }),
            fill: new ol.style.Fill({
                color: 'magenta'
            }),
            image: new ol.style.Circle({
                radius: 10,
                fill: null,
                stroke: new ol.style.Stroke({
                    color: 'magenta'
                })
            })
        })
    ],
    'Circle': [
        new ol.style.Style({
            stroke: new ol.style.Stroke({
                color: 'red',
                width: 2
            }),
            fill: new ol.style.Fill({
                color: 'rgba(255,0,0,0.2)'
            })
        })
    ]
};

var styleFunction = function (feature, resolution) {
    return styles[feature.getGeometry().getType()];
};
接著,撰寫頁面開啟後預先執行的函式initTOCLayer()。
先去判斷是否已經有撈過圖層清單的資料了,以TOCArray是否有資料來判斷,若有資料,則依據TOCArray內的數據來進行頁面的建立(因為使用者對圖層有任何操作都會存回到這個清單當中)。
我們明天會撰寫center and zoom to 圖層範圍的功能,所以我們在建立頁面的清單列表的時候,就要先考慮到哪些資料會有範圍typehasExtent可以進行定位,以本次範例來說就是GeoJSON、GPX、KML這三種具有feature資料。
function initTOCLayer() {
    var typehasExtent = ['GeoJSON', 'GPX', 'KML'];
    if (TOCArray.length !== 0) {
        console.log(TOCArray);
        var layerlisthtml = "";
        $.each(TOCArray, function (index, item) {
            var checked = false;
            if (map.e_getLayer(item.LayerID) === undefined) {
                loadLayer(item);
                checked = false;
            } else {
                if (item.OpenOpacity !== "0") {
                    checked = true;
                } else {
                    checked = false;
                }
            }
            var checkboxhtml = (checked === false ? '<div class="ui checkbox"><input type="checkbox" name="example" onclick="toc.toggleTocLayer(\'' + item.LayerID + '\', this)">' : '<div class="ui checkbox"><input type="checkbox" name="example" onclick="toc.toggleTocLayer(\'' + item.LayerID + '\', this)" checked="' + checked + '">');
            var layerlisthtml_part = '<div class="item">' + checkboxhtml + '<label></label></div><div class="content"><a class="header">' + item.LayerTitle + '</a><div class="description">' + item.DataType + '</div>';
            if (typehasExtent.includes(item.DataType)) {
                layerlisthtml_part += '<img class="layerBtns info" src="images/TOCpage/info.png" title="點擊定位圖層" onclick="toc.zoomTocLayer(\'' + item.LayerID + '\')">';
            }
            layerlisthtml_part += '</div></div>';
            layerlisthtml += layerlisthtml_part;
        });
        $("#layerlist").html(layerlisthtml);
    } else {
        // ★★★ 介接前述建立的WebService ★★★
    }
}
以下說明介接WebService(以下簡稱WS)的寫法,以ajax Post的方法進行介接,路徑則是ws的路徑 + getLayerResource。
若介接成功success則執行success內的function,因我們在WS裡面已經將資料進行stringify了,因此在這邊要先parse回來,才可以存成物件,jquery的$.parseJSON或是js的JSON.parse兩種方法都可以,解析完資料後即可組html後塞回頁面中。
// ★★★ 介接前述建立的WebService ★★★
$.ajax({
    type: "POST",
    url: config_WSLayerResource + "/getLayerResource",
    dataType: "json",
    contentType: "application/json; charset=utf-8",
    success: function (d) {
        var data = $.parseJSON(d.d);
        console.log(data);
        var layerlisthtml = "";
        TOCArray = [];
        $.each(data, function (index, item) {
            loadLayer(item);
            if (typehasExtent.includes(item.DataType)) {
                layerlisthtml += '<div class="item"><div class="ui checkbox"><input type="checkbox" name="example" onclick="toc.toggleTocLayer(\'' + item.LayerID + '\', this)"><label></label></div><div class="content"><a class="header">' + item.LayerTitle + '</a><div class="description">' + item.DataType + '</div><img class="layerBtns info" src="images/TOCpage/info.png" title="點擊定位圖層" onclick="toc.zoomTocLayer(\'' + item.LayerID + '\')"></div></div>';
            } else {
                layerlisthtml += '<div class="item"><div class="ui checkbox"><input type="checkbox" name="example" onclick="toc.toggleTocLayer(\'' + item.LayerID + '\', this)"><label></label></div><div class="content"><a class="header">' + item.LayerTitle + '</a><div class="description">' + item.DataType + '</div></div></div>';
            }
            TOCArray.push(item);
        });
        $("#layerlist").html(layerlisthtml);
    },
    error: function (jqXHR, exception) {
        ajaxError(jqXHR, exception);
    }
});
頁面顯示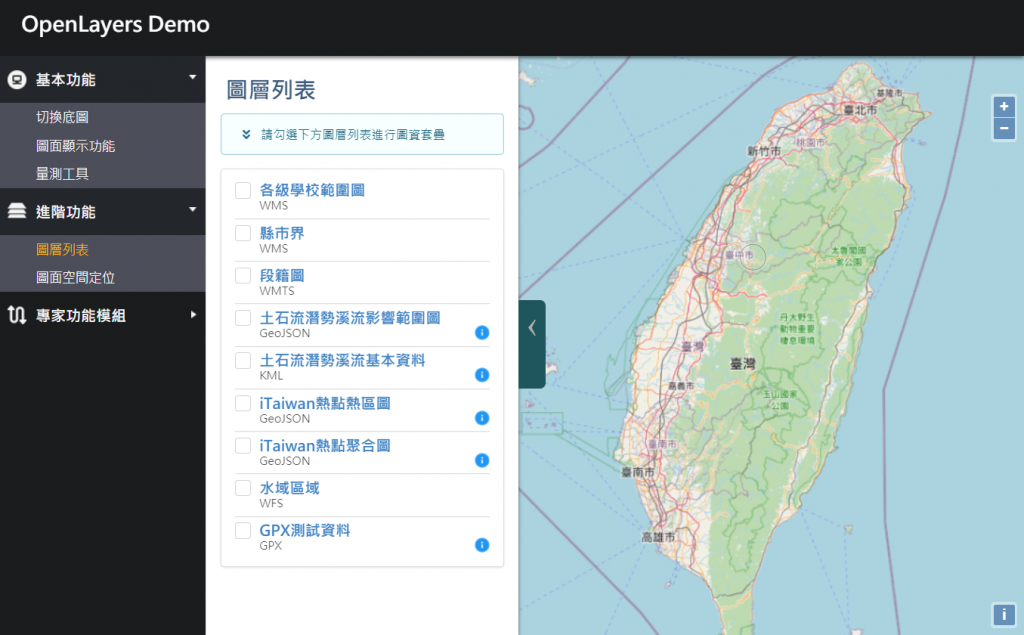
上面我們已經將頁面完整的建立好了,如果大家還記得之前的文章 Day 07. WebGIS基本 #1:底圖切換、地圖小工具 裡的底圖載入流程,應該就知道我們現在只有網頁頁面而已,地圖上還沒有任何的圖資在上面,功能也都還沒有任何的作用,所以我們現在就要將多元的圖資載入到地圖上。
縣市界的部分因為是介接自己發布的地圖服務,所以在今天先不載入,明天會再說明載入的方式與如何修改。
function loadLayer(json) {
    var layer;
    var source;
    // 判斷圖資檔案格式,不同的格式會有不同的寫法,這邊分為WMS、WMTS、WFS、GeoJSON、KML、GPX
    if (json.DataType === "WMS") {
        source = new ol.source.TileWMS({
            url: json.DataURL,
            params: {
                'LAYERS': json.LayerVisibleCode,
                'TILED': true,
                'FORMAT': 'image/png',
                'VERSION': '1.1.1'
            },
            serverType: 'geoserver',
            // Countries have transparency, so do not fade tiles:
            transition: 0
        });
    } else if (json.DataType === "WMTS") {
        var projection = ol.proj.get('EPSG:3857');
        var projectionExtent = projection.getExtent();
        var size = ol.extent.getWidth(projectionExtent) / 256;
        var resolutions = new Array(14);
        var matrixIds = new Array(14);
        for (let z = 0; z < 14; ++z) {
            // generate resolutions and matrixIds arrays for this WMTS
            resolutions[z] = size / Math.pow(2, z);
            matrixIds[z] = z;
        }
        source = new ol.source.WMTS({
            url: json.DataURL,
            layer: json.LayerVisibleCode,
            matrixSet: 'EPSG:3857',
            format: 'image/png',
            projection: projection,
            tileGrid: new ol.tilegrid.WMTS({
                origin: ol.extent.getTopLeft(projectionExtent),
                resolutions: resolutions,
                matrixIds: matrixIds
            }),
            style: 'default',
            wrapX: true
        });
    } else if (json.DataType === "WFS") {
        source = new ol.source.Vector({
            format: new ol.format.GeoJSON(),
            url: function (extent) {
                return json.DataURL + '?service=WFS&' +
                    'version=1.1.0&request=GetFeature&typename=' + json.LayerVisibleCode + '&' +
                    'outputFormat=application/json&srsname=EPSG:3857&' +
                    'bbox=' + extent.join(',') + ',EPSG:3857';
            },
            strategy: ol.loadingstrategy.bbox
        });
    } else if (json.DataType === "GeoJSON") {
        source = new ol.source.Vector({
            url: json.DataURL + '/' + json.LayerVisibleCode,
            format: new ol.format.GeoJSON()
        });
    } else if (json.DataType === "KML") {
        source = new ol.source.Vector({
            url: json.DataURL + '/' + json.LayerVisibleCode,
            format: new ol.format.KML()
        });
    } else if (json.DataType === "GPX") {
        source = new ol.source.Vector({
            url: json.DataURL + '/' + json.LayerVisibleCode,
            format: new ol.format.GPX()
        });
    }

    // 判斷圖資的載入顯示方式,這邊的Tile不是單指圖磚的意思,而是以image的方式載入的都使用Tile的方法,像是WMS、WMTS都是這種
    // 分為Tile、Vector、Heatmap(熱點圖)、Cluster(群聚圖)
    if (json.LayerType === "Tile") {
        layer = new ol.layer.Tile({
            opacity: 0,
            source: source
        });
    } else if (json.LayerType === "Vector") {
        layer = new ol.layer.Vector({
            source: source,
            style: styleFunction
        });
    } else if (json.LayerType === "Heatmap") {
        layer = new ol.layer.Heatmap({
            source: source,
            blur: parseInt(15, 10),
            radius: parseInt(2, 10)
        });
    } else if (json.LayerType === "Cluster") {
        var styleCache = {};
        // 群聚圖的樣式比較不同,需要另外設定
        layer = new ol.layer.Vector({
            source: new ol.source.Cluster({
                distance: parseInt(30, 10),
                source: source
            }),
            style: function (feature) {
                var size = feature.get('features').length;
                var style = styleCache[size];
                if (!style) {
                    style = new ol.style.Style({
                        image: new ol.style.Circle({
                            radius: 15,
                            stroke: new ol.style.Stroke({
                                color: '#fff'
                            }),
                            fill: new ol.style.Fill({
                                color: '#3E5E7E'
                            })
                        }),
                        text: new ol.style.Text({
                            text: size.toString(),
                            fill: new ol.style.Fill({
                                color: '#fff'
                            })
                        })
                    });
                    styleCache[size] = style;
                }
                return style;
            }
        });
    }
    // 設定id、透明度預設為0表示圖層不開啟、並加到map當中
    layer.id = json.LayerID;
    layer.setOpacity(0);
    map.addLayer(layer);
}
這邊我要說明一下,因為現在的圖資很少,所以我可以使用這種方式在頁面載入時,就先將所有的圖資載入到地圖上;但如果圖資多到爆炸,就不建議採用這種方式,可以在按下加入的瞬間再載入,避免造成效能上的負擔。
由於今天的內容太多,為了讓大家好消化,剩下的部份我們明天再說!
今天學會了如何從資料庫撈資料、撰寫WebService後給前端介接,前端介接到資料後分析資料並展示在頁面上,並將圖資加到地圖中。
明天我們會有以下三個小主題:
明天再一起說明整體功能的結論吧!