當我們初步了解Angular的框架後,接著我要介紹一套視覺化套件-ZingChart
ZingChart is a self-contained, dependency-free library that’s compatible with all browsers. We >are dedicated to shipping quality commercial software for your web application.
The library is totally contained. This means the entire state, data, and configuration of any >chart can be saved as a JSON packet. This single source of truth makes it very easy to pass >around chart information in an application.
ZingChart已經把library包含進去了~
The library has ZERO non-native browser dependencies. This allows for strong backwards >compatibility and easy integration across any web platform.
相容性高、相當容易在平台之間移轉
ZingChart不但在各種框架下都有支援,當然也包括Angular囉!
zingchart-angular is an Angular Typescript directive to allow ZingChart to work dynamically >with data. Quickly add charts to your Angular application with our ZingChart component. This >guide assumes some basic working knowledge of Angular.
zingchart為Angular準備的ts組件
安裝方式如下
npm install zingchart-angular --legacy-peer-deps
接著我們在app.module.ts引入這個模組
import { NgModule } from '@angular/core';
import { BrowserModule } from '@angular/platform-browser';
import { ZingchartAngularModule } from 'zingchart-angular';

import { AppRoutingModule } from './app-routing.module';
import { AppComponent } from './app.component';

@NgModule({
  declarations: [
    AppComponent
  ],
  imports: [
    BrowserModule,
    AppRoutingModule,
    ZingchartAngularModule
  ],
  providers: [],
  bootstrap: [AppComponent]
})
export class AppModule { }
在component裡面新增他的設定屬性 app.component.ts
import { Component } from '@angular/core';

@Component({
  selector: 'app-root',
  templateUrl: './app.component.html',
  styleUrls: ['./app.component.css']
})
export class AppComponent {
  config:zingchart.graphset = {
    type: 'line',
    series: [{
      values: [3,6,4,6,4,6,4,6]
    }],
  };
}
最後在html模板上插入zingchart-angular
<zingchart-angular [config]="config" [height]="500"></zingchart-angular>
儲存後就可以看到頁面show出
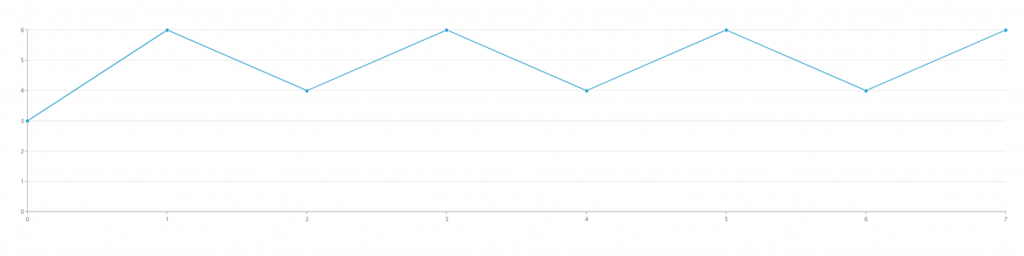
更多ZingChart套件的使用方式,讓我們之後再繼續說明吧!
安裝zingchartz發生了以下問題,請問有解決的辦法嗎

找到問題了
要手動去zing-angular新增zingchart
讚讚喔~~