今天繼續了解三本柱中的Metrics在OTel中的規範
如同Day6提到的client架構, Otel Metrics也是分成API與SDK兩大部份.

OTel metrics, 需要透過全局的MeterProvider來建立數個Meter並且指定數個Instruments相關連來獲取metrics, 每個INstruments用來建立一系列的Measurements.
這些measurements會在in-memory state(或者稱View)中聚合成一個metric.
Metric reader在讀取出來後, 給Metric Exporter匯出(可以提供Pull/Push).
其中的MeterProvider、Meter與Instruements都是屬於API的範疇.
Async的instrument type, 需要使用Observe去觀察對象的值, 通常用在像是我們去看資源的使用率.
來個很粗淺的範例, 透過Prometheus exporter以及OTel metric
簡單的展示怎麼呈現自定義的metric
package main

import (
	"context"
	"fmt"
	"log"
	"math/rand"
	"net/http"
	"os"
	"os/signal"
	"time"

	"go.opentelemetry.io/otel/attribute"
	"go.opentelemetry.io/otel/exporters/prometheus"
	"go.opentelemetry.io/otel/metric"
	"go.opentelemetry.io/otel/metric/global"
	"go.opentelemetry.io/otel/metric/instrument"
	"go.opentelemetry.io/otel/metric/unit"
	"go.opentelemetry.io/otel/sdk/metric/aggregator/histogram"
	controller "go.opentelemetry.io/otel/sdk/metric/controller/basic"
	"go.opentelemetry.io/otel/sdk/metric/export/aggregation"
	processor "go.opentelemetry.io/otel/sdk/metric/processor/basic"
	selector "go.opentelemetry.io/otel/sdk/metric/selector/simple"
    "go.opentelemetry.io/otel/sdk/resource"
	semconv "go.opentelemetry.io/otel/semconv/v1.10.0"
)

func initMeter() error {
	res, err := resource.New(context.Background(),
		resource.WithFromEnv(),
		resource.WithProcess(),
		resource.WithTelemetrySDK(),
		resource.WithHost(),
		resource.WithAttributes(
			// the service name used to display traces in backends
			semconv.ServiceNameKey.String("ITHOME_14th_Server"),
			attribute.String("environment", "LOCAL"),
		),
	)

	config := prometheus.Config{
		DefaultHistogramBoundaries: []float64{1, 2, 5, 10, 20, 50},
	}

	c := controller.New(
		processor.NewFactory(
			selector.NewWithHistogramDistribution(
				histogram.WithExplicitBoundaries(config.DefaultHistogramBoundaries),
			),
			aggregation.CumulativeTemporalitySelector(),
			processor.WithMemory(true),
		),
		controller.WithResource(res),
	)

	exporter, err := prometheus.New(config, c)
	if err != nil {
		return fmt.Errorf("failed to initialize prometheus exporter: %w", err)
	}
	global.SetMeterProvider(exporter.MeterProvider())
	http.HandleFunc("/", exporter.ServeHTTP)
	go func() {
		_ = http.ListenAndServe(":2222", nil)
	}()

	fmt.Println("Prometheus server running on :2222")
	return nil
}

func main() {
	if err := initMeter(); err != nil {
		log.Fatal(err)
	}

	meter := global.Meter("ithome.com/14th")
	go counter(context.Background(), meter)
	go counterWithLabels(context.Background(), meter)
	go upDownCounter(context.Background(), meter)
	go histogramCase(context.Background(), meter)
	go gaugeCase(context.Background(), meter)


	ctx, stop := signal.NotifyContext(context.Background(), os.Interrupt)
	defer stop()

	fmt.Println("Example finished updating, please visit :2222")

	<-ctx.Done()

}

func gaugeCase(ctx context.Context, meter metric.Meter) {
	memoryUsage, _ := meter.AsyncFloat64().Gauge(
		"MemoryUsage",
		instrument.WithUnit(unit.Bytes),
	)
	for {
		memoryUsage.Observe(ctx, rand.Float64())
		time.Sleep(time.Second)
	}
}


func counter(ctx context.Context, meter metric.Meter) {
	counter, _ := meter.SyncInt64().Counter(
		"request counter",
		instrument.WithUnit("1"),
		instrument.WithDescription("total request"),
	)

	for {
		counter.Add(ctx, 1)
		time.Sleep(time.Second)
	}
}

func counterWithLabels(ctx context.Context, meter metric.Meter) {
	counter, _ := meter.SyncInt64().Counter(
		"cache",
		instrument.WithDescription("Cache hits and misses"),
	)
	for {
		if rand.Float64() < 0.3 {
			// increment hits
			counter.Add(ctx, 1, attribute.String("type", "hits"))
		} else {
			// increments misses
			counter.Add(ctx, 1, attribute.String("type", "misses"))
		}

		time.Sleep(time.Second)
	}
}

func upDownCounter(ctx context.Context, meter metric.Meter) {
	counter, _ := meter.SyncInt64().UpDownCounter(
		"up_down_counter",
		instrument.WithUnit("1"),
		instrument.WithDescription("up down counter"),
	)

	for {
		if rand.Float64() >= 0.5 {
			counter.Add(ctx, +1)
		} else {
			counter.Add(ctx, -1)
		}

		time.Sleep(time.Second)
	}
}

func histogramCase(ctx context.Context, meter metric.Meter) {
	durRecorder, _ := meter.SyncInt64().Histogram(
		"histogram",
		instrument.WithUnit("microseconds"),
		instrument.WithDescription("histogram"),
	)

	for {
		dur := time.Duration(rand.NormFloat64()*5000000) * time.Microsecond
		durRecorder.Record(ctx, dur.Microseconds())

		time.Sleep(time.Millisecond)
	}
}
瀏覽器輸入localhost:2222
會看到類似的數據畫面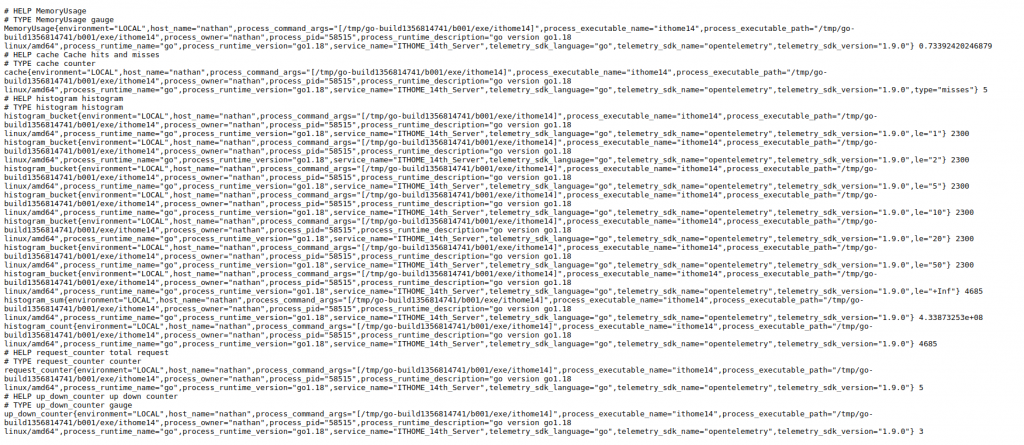
有些resource context,是OTel reousce package自動偵測到的內容.
OTel metrics還是希望對現有的流行標準做擴充, 但必須得使用它提供的語意與規範來走.
學習難度相對Prometheus, StatsD都高不少, 因為變成要知道兩邊怎用.
請問雷N大大,之後會有篇幅介紹與 Prometheus 的差異比較嗎?
有打算耶XD
(讓我周末多爬官網學習吸收一下 )