今天繼續上一篇的範例
我們已經建好模型了
今天要來改善線的平滑度與測試模型
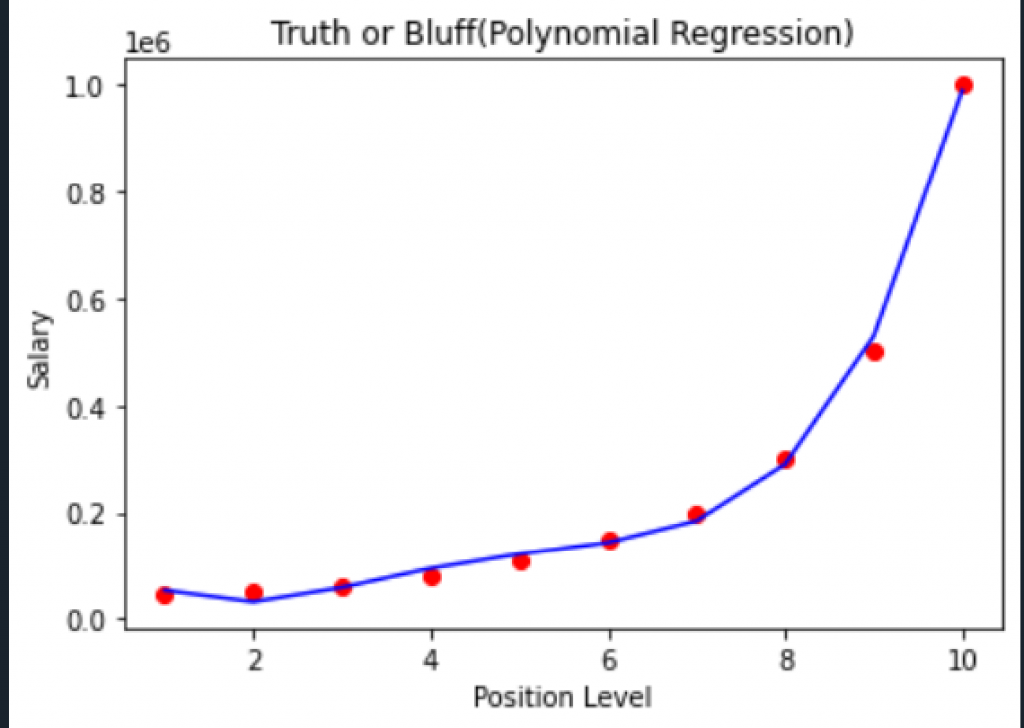
在試過好幾的degree後可以發現用degree=4 會讓模型結果更接近實測值
不過紅點跟紅點之間其實還不是平滑的曲線, 都像是直線
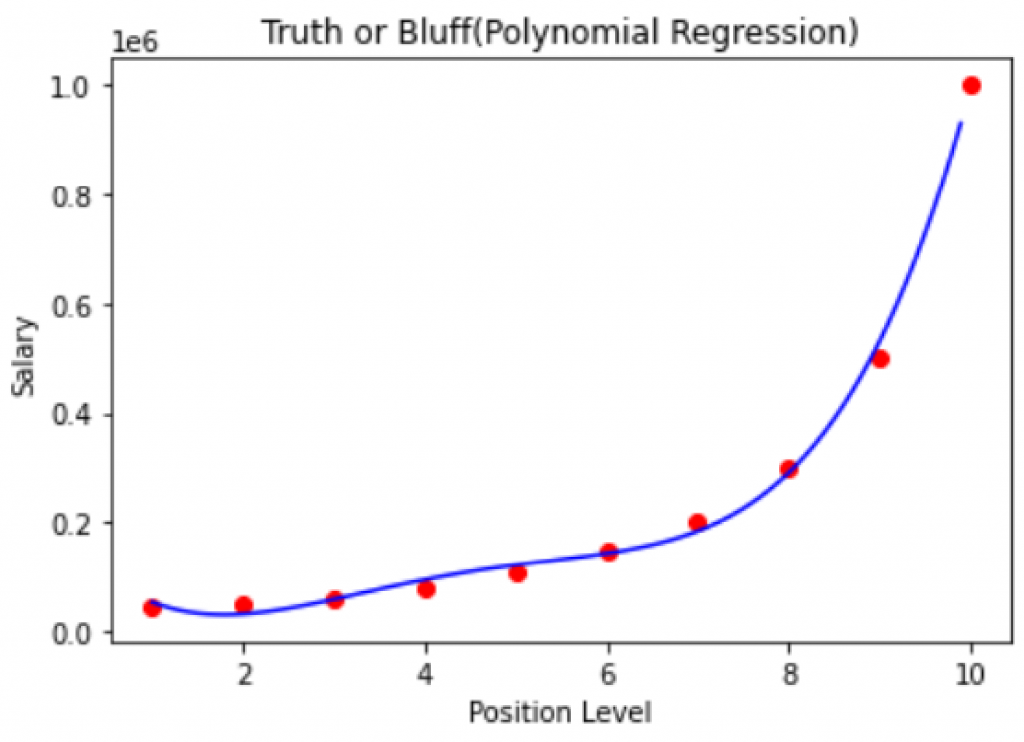
點跟點之間不平滑的原因是兩點間距過大, 若讓兩點間距縮小就可以讓線更平滑
接著我們把原本話polynomial regression 的程式碼區段小改一下
加入兩個function 來實現“新增更多點讓間距更小”
x_grid = np.arange(start = min(x), stop = max(x), step = 0.1)
新增一個x_grid array 並設起點為x的最小值, 終點為x的最大值, 間距為0.1
x_grid = x_grid.reshape(len(x_grid), 1)
將x_grid array轉成 [len(x_grid) * 1] 的矩陣
# Visualising the Polynomial Regression results
## show the actual results
x_grid = np.arange(start = min(x), stop = max(x), step = 0.1)
x_grid = x_grid.reshape(len(x_grid), 1)
plt.scatter(x, y, color = 'red')
## show the predict results with linear regression model
## poly_reg.fit_transform(x) equals to x_poly
plt.plot(x_grid, lin_reg_2.predict(poly_reg.fit_transform(x_grid)), color='blue')
## title
plt.title('Truth or Bluff(Polynomial Regression)')
plt.xlabel('Position Level')
plt.ylabel('Salary')
plt.show()
畫出來結果如下:

現在建立好模型後, 我們可以用模型預測出面試者在B公司的薪資了
假設面試者的職等(level)大約是6.5等
我們可以直接用predict() 帶入6.5 來得到預測結果
不過需注意的是sklearn 2.0 開始所有input都必須是二維矩陣
因此不能像老師一樣直接帶入6.5 (會出現下面error msg)
ValueError: Expected 2D array, got 1D array instead:
array=[6.5].
Reshape your data either using array.reshape(-1, 1) if your data has a single feature or array.reshape(1, -1) if it contains a single sample.
因此這裡我們先創建一個array = [6.5]
接著需叫reshape(-1,1)來轉成二維矩陣
再將二維矩陣帶入predict()
# Predicting a new result with Linear Regression
x_interviewer_level = np.array([6.5])
x_interviewer_level = x_interviewer_level.reshape(-1, 1)
y_interviewer_salary = lin_reg.predict(x_interviewer_level)

# Predicting a new result with Polynomial Regression
y_interviewer_salary_2 = lin_reg_2.predict(poly_reg.fit_transform(x_interviewer_level))
run完後的結果是
y_interviewer_salary = 330378 -> 用線性回歸算的
y_interviewer_salary_2 = 158862 -> 用多項式線性回歸算的(degree=4)
結論是interviewer在B公司的薪資應該是158862
若用線性迴歸的結果330378反而會讓公司多花錢雇用此面試者
以下列出我在Polynomial Regression 四篇裡的完整範例
#!/usr/bin/env python3
# -*- coding: utf-8 -*-
"""
Created on Fri Sep 30 21:55:08 2022

@author: ireneluo
"""
import numpy as np
import matplotlib.pyplot as plt
import pandas as pd

from sklearn.preprocessing import LabelEncoder
from sklearn.preprocessing import OneHotEncoder
from sklearn.compose import ColumnTransformer

"""
1. Preprocessing
   1. importing the dataset
      x contains "Level"
      y contains "Salary"
   2. categorical data
   3. splitting the dataset into the training set and test set
"""
dataset = pd.read_csv('Position_Salaries.csv')
# x = dataset.iloc[:, 1].values -> wrong, since x will be an array(should be a matrix)
x = dataset.iloc[:,1:2].values
y = dataset.iloc[:, 2].values

"""
# no need in this example
from sklearn.model_selection import train_test_split
x_train, x_test, y_train, y_test = train_test_split(x,y,test_size=0.2, random_state=0)
"""
# Fitting Linear Regression to the dataset
from sklearn.linear_model import LinearRegression
lin_reg = LinearRegression()
lin_reg.fit(x, y)

# Fitting Polynomial Regression to the dataset
from sklearn.preprocessing import PolynomialFeatures
poly_reg = PolynomialFeatures(degree = 4)
x_poly = poly_reg.fit_transform(x)
lin_reg_2 = LinearRegression()
lin_reg_2.fit(x_poly, y)

# Visualizing the Linear Regression results
## show the actual results
plt.scatter(x, y, color = 'red')
## show the predict results with linear regression model
plt.plot(x, lin_reg.predict(x), color='blue')
## title
plt.title('Truth or Bluff(Linear Regression)')
plt.xlabel('Position Level')
plt.ylabel('Salary')
plt.show()

# Visualising the Polynomial Regression results
## show the actual results
x_grid = np.arange(start = min(x), stop = max(x), step = 0.1)
x_grid = x_grid.reshape(len(x_grid), 1)
plt.scatter(x, y, color = 'red')
## show the predict results with linear regression model
## poly_reg.fit_transform(x) equals to x_poly
plt.plot(x_grid, lin_reg_2.predict(poly_reg.fit_transform(x_grid)), color='blue')
## title
plt.title('Truth or Bluff(Polynomial Regression)')
plt.xlabel('Position Level')
plt.ylabel('Salary')
plt.show()

# Predicting a new result with Linear Regression
x_interviewer_level = np.array([6.5])
x_interviewer_level = x_interviewer_level.reshape(-1, 1)
y_interviewer_salary = lin_reg.predict(x_interviewer_level)

# Predicting a new result with Polynomial Regression
y_interviewer_salary_2 = lin_reg_2.predict(poly_reg.fit_transform(x_interviewer_level))
