接下來這幾天開始會來跑這次鐵人賽的主線 也就是監控的部分
這邊先列出應該會使用到的服務
主要使用這些服務來做到一個完整的監控系統
目標要做到的功能大致如下
先來安裝 Prometheus 本體
apt-get install Prometheus -y
摁 安裝好了 非常棒 偉摘 Debian 直接把複雜的安裝流程簡化到只需要 APT 就能處理完了嗚呼! 今天的鐵人賽就這樣下班了
沒啦 先來看看 Debian 幫我們裝了那些套件上來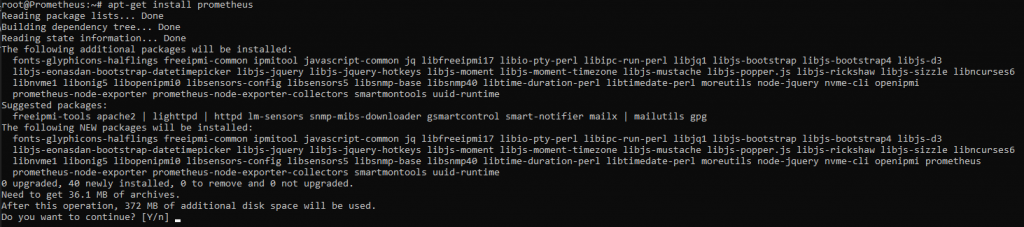
從 apt-get install 這邊可以看到裝了許多套件上來
關於 Prometheus 本身的有這三個
這樣的話理論上就能透過本身的 Node exporter 來 pull 出資料就來試試看吧
先連線到 Prometheus 的管理頁面看看
http://Prometheus.ironman.test:9090
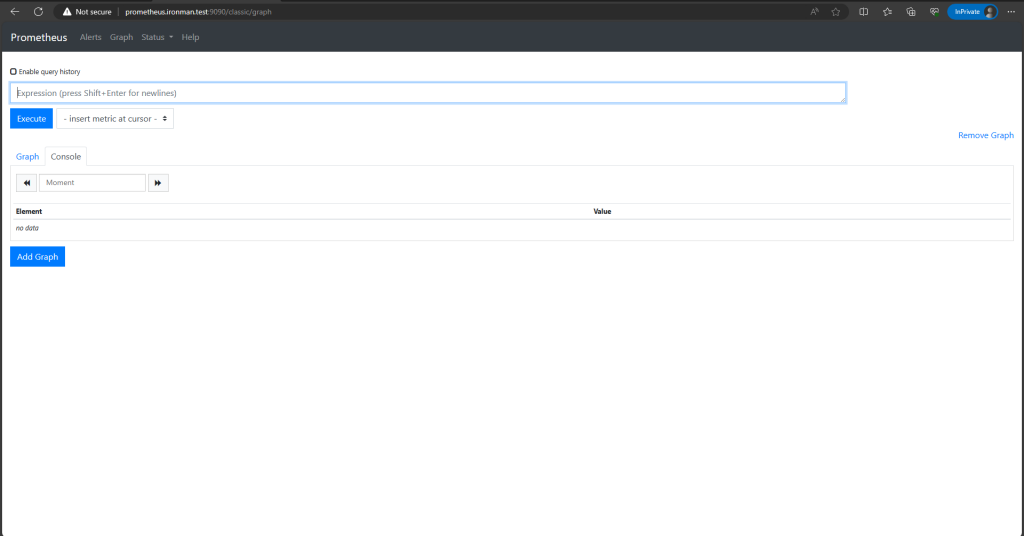
接著打開左上角 Status -> Configuration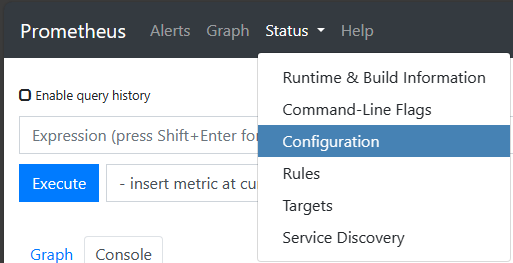
來看看設定檔
global:
  scrape_interval: 15s
  scrape_timeout: 10s
  evaluation_interval: 15s
  external_labels:
    monitor: example
alerting:
  alertmanagers:
  - follow_redirects: true
    enable_http2: true
    scheme: http
    timeout: 10s
    api_version: v2
    static_configs:
    - targets:
      - localhost:9093
scrape_configs:
- job_name: prometheus
  honor_timestamps: true
  scrape_interval: 5s
  scrape_timeout: 5s
  metrics_path: /metrics
  scheme: http
  follow_redirects: true
  enable_http2: true
  static_configs:
  - targets:
    - localhost:9090
- job_name: node
  honor_timestamps: true
  scrape_interval: 15s
  scrape_timeout: 10s
  metrics_path: /metrics
  scheme: http
  follow_redirects: true
  enable_http2: true
  static_configs:
  - targets:
    - localhost:9100
摁 看起來今天的工作都被 Debian 給搶走了 萬分感謝 Debian 讓我提早下班
在 scrape_configs 裡的 job_name: node 這邊定義了透過本機的 9100 Port (Node Exporter) pull Metric
那這樣的話就來檢視看看預設的有沒有成功
用 prometheus_http_requests_total 來查詢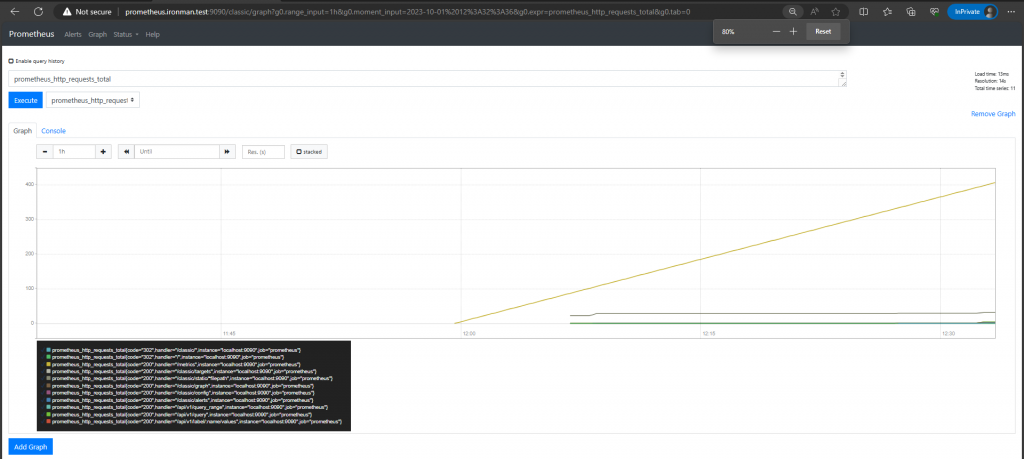
看起來非常的成功 不過 /metric 路徑為何一直被敲勒?
沒事的 那是 prometheus 正常在 pull metric 產生的正常流量