昨天我們完成了資料結構的設計,並響應式數據擴充動畫物件,讓動畫執行時能夠呼叫 updateVertices,今天我們將把它完成,
建議先看過這三文章:
歸功於 BufferGeometry 提供的靈活性,我們可以製作任何想要的形狀。針對如何動態更新頂點數據,在我們系列文 D4 已經詳細說過:
column.updateVertices = (index) => {
    // 步驟1:取得頂點
    const [newVertices, colorVertices] = this.getColumnVerticesByAngle();

    // 步驟2:動態更新數據
    const cubeVertexCount = 36;
    const vertexIndex = index * cubeVertexCount * 3;

    const vertices = column.geometry.attributes.position.array;
    const color = column.geometry.attributes.color.array;
    for(let N = 0; N < cubeVertexCount * 3; N ++){
        vertices[vertexIndex + N] = newVertices[N];
    }
    for(let N = 0; N < cubeVertexCount * 3; N ++){
        color[vertexIndex + N] = colorVertices[N];
    }

    column.geometry.attributes.position.needsUpdate = true;
    column.geometry.attributes.color.needsUpdate = true;
}
在這裡,我們主要任務在於完成一個相對複雜的頂點演算法,我們需要輸入的參數有以下幾種:
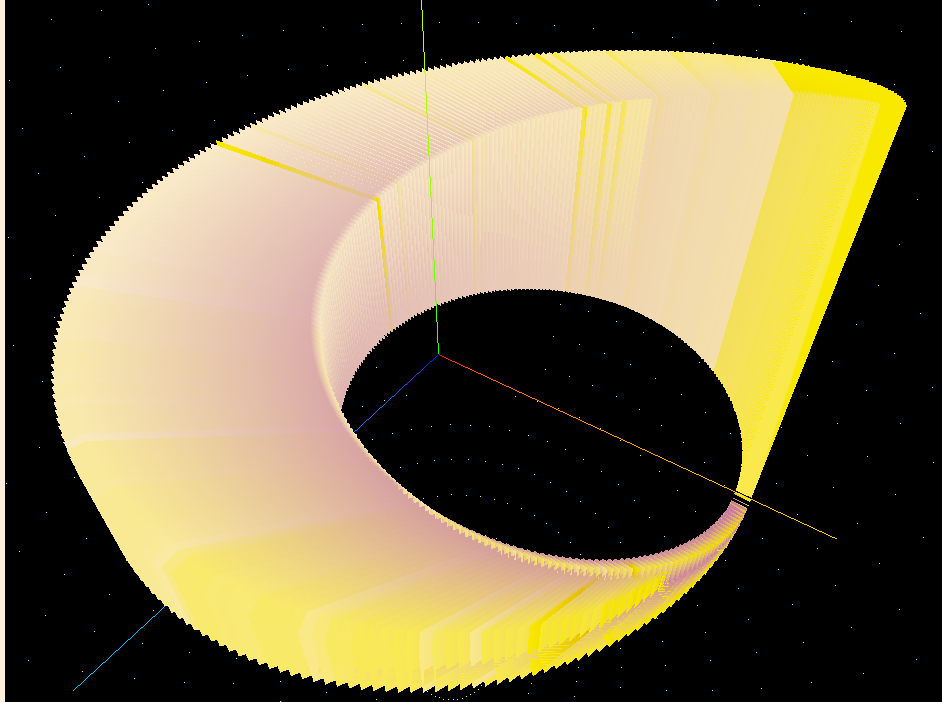
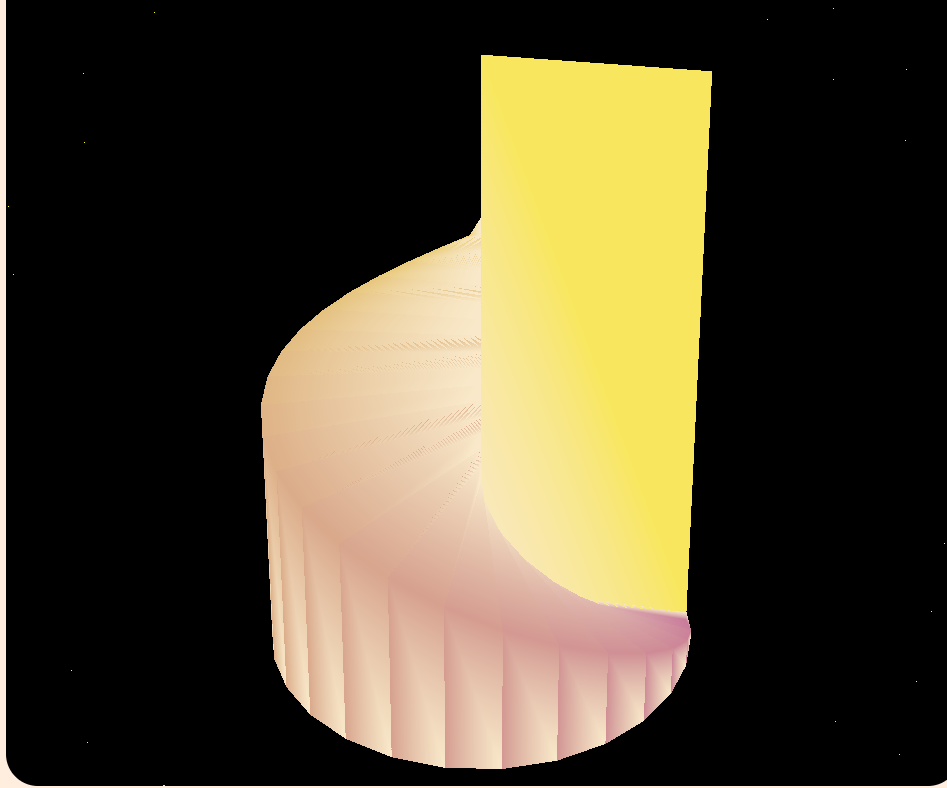
在製作過程中,我也實現了以下幾種變體,可以一邊參考它,一邊猜猜看,接下來我們實作的圖形長什麼樣?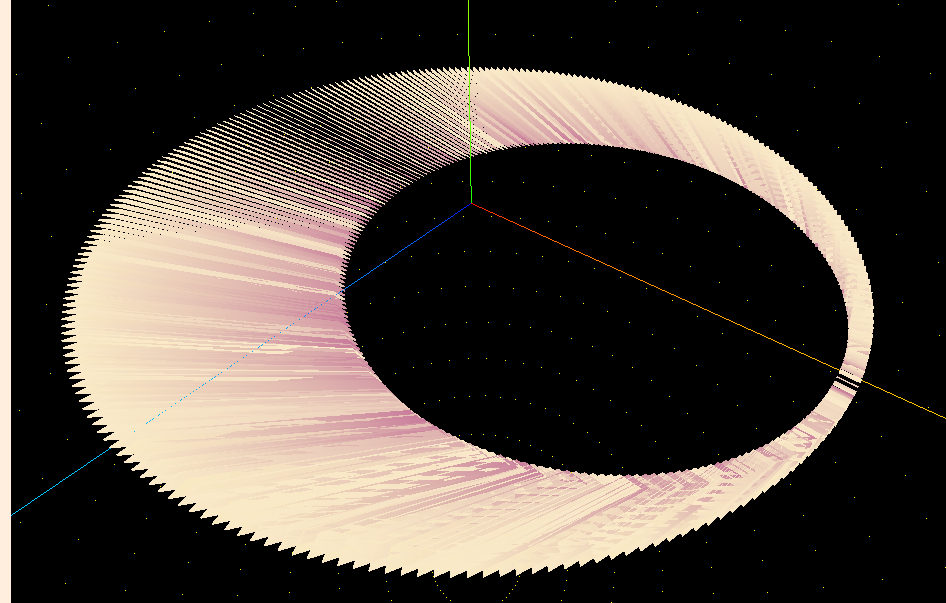
其中,在排序演算法中,我們是透過索引值來分配柱體的基礎座標,不會改變它,僅通過交換數據(高度)的方式,來達成動畫效果。因此我們利用 index 來計算該柱體的資訊:
// 步驟1:取得頂點
// 根據索引值取得旋轉朝向
const startAngle = (index / column.length) * Math.PI * 2;
const endAngle = ((index + 1) / column.length) * Math.PI * 2;
const height = column.geometryData[index].height;
// 根據動畫物件取得座標和顏色梯度
const path = column.geometryData[index].path;
const {pointX, pointY, z, timer, period} = path;
const x = pointX - z * Math.cos(startAngle);
const y = pointY - z * Math.sin(startAngle);
const transition = 1 - timer / period;
// 呼叫頂點演算法
const [newVertices, colorVertices] = this.getColumnVerticesByAngle(
    x, y, z * 0.1,
    column.radius, column.depth,
    height, column.unitHeight,
    startAngle, endAngle, transition
);
這裡延續系列文 D2 繪製二維柱體時,動畫和漸層的運作方式,使用以下參數:
我們使用三個步驟來完成柱體頂點的輸出,包括頂點座標的計算、顏色的準備、以及根據索引繪製三角形片段。這樣的結構允許我們靈活控制柱體的形狀、顏色和動畫效果:
getColumnVerticesByAngle(centerX, centerY, z, r, depth, height, unitHeight, startAngle, endAngle, transition) {
    // 1. 頂點座標的準備
    const vertices = new Float32Array(36 * 3);

    // 2. 頂點顏色的準備
    const colorVertices = new Float32Array(36 * 3);

    // 3. 根據索引值繪製三角形片段
    const indices = new Uint8Array([
        // 前面
        1, 2, 3,
        1, 3, 4,
        // 後面
        5, 6, 7,
        5, 7, 8,
        // 左面
        1, 4, 6,
        1, 6, 5,
        // 右面
        2, 8, 7,
        2, 7, 3,
        // 上面
        3, 7, 6,
        3, 6, 4,
        // 下面
        1, 5, 8,
        1, 8, 2
    ]);
    indices.forEach((point) => {
        addPoint[point]();
        addColor[point]();
    })
    // 返回圓餅切片-長方體的 36 個頂點坐標、頂點顏色
    return [vertices, colorVertices];
}
座標方面會相對複雜一些,首先我們需要歸零座標,來計算八個點的相對位置:
const getXY = (radius, angle) => {
    const x = centerX + radius * Math.cos(angle) - r * Math.cos(startAngle);
    const y = centerY + radius * Math.sin(angle) - r * Math.sin(startAngle);
    return [x, y];
}
透過這個方式我們將第四個點歸零(完整半徑和起始角度):
getColumnVerticesByAngle(centerX, centerY, z, r, depth, height, unitHeight, startAngle, endAngle, transition) {
    const vertices = new Float32Array(36 * 3);
    let idx = 0;
    const push = (x, y, z) => {
        vertices[idx++] = x;
        vertices[idx++] = z;
        vertices[idx++] = y;
    }
    const getXY = (radius, angle) => {
        const x = centerX + radius * Math.cos(angle) - r * Math.cos(startAngle);
        const y = centerY + radius * Math.sin(angle) - r * Math.sin(startAngle);
        return [x, y];
    }
    const [x1, y1] = getXY(r - depth, startAngle);
    const [x2, y2] = getXY(r - depth, endAngle);
    const [x3, y3] = getXY(r, endAngle);
    const [x4, y4] = getXY(r, startAngle);

    const addPoint = {};
    const h = unitHeight / 2;
    addPoint[1] = () => { push(x1, y1, z + height - h + 10) }; // 上面左側
    addPoint[2] = () => { push(x2, y2, z + height + h + 10) }; // 上面右側
    addPoint[3] = () => { push(x3, y3, z + height + h) }; // 上面右側外側
    addPoint[4] = () => { push(x4, y4, z + height - h) }; // 上面左側外側
    addPoint[5] = () => { push(x1, y1, z) }; // 下面左側
    addPoint[6] = () => { push(x4, y4, z) }; // 下面左側外側
    addPoint[7] = () => { push(x3, y3, z) }; // 下面右側外側
    addPoint[8] = () => { push(x2, y2, z) }; // 下面右側
}
對於顏色,我們使用梯度來製作漸層,相信這個部分大家比較熟悉一些:
let idx2 = 0;
const colorVertices = new Float32Array(36 * 3);
const pushBRG = (x, y, z) => {
    colorVertices[idx2++] = x;
    colorVertices[idx2++] = y;
    colorVertices[idx2++] = z;
}
const tran = Math.sin(this.#transitionRadian);
// 計算每個立方體的顏色
const r1 = 0.200 + height / 255 * (0.816 - 0.200);
const g1 = 0.329 + height / 255 * (0.590 - 0.329) * tran;
const b1 = 0.584 + height / 255 * (0.949 - 0.584);

const r2 = 0.200 + transition * (0.816 - 0.200);
const g2 = 0.329 + transition * (0.590 - 0.329);
const b2 = 0.584 + transition * (0.949 - 0.584);

const addColor = {};
addColor[1] = () => { pushBRG(b2, r2, g2) }; // 上面左側
addColor[2] = () => { pushBRG(b1, r1, g1) }; // 上面右側
addColor[3] = () => { pushBRG(b1, r1, g1) }; // 上面右側外側
addColor[4] = () => { pushBRG(b1, r1, g1) }; // 上面左側外側
addColor[5] = () => { pushBRG(b2, r2, g2) }; // 下面左側
addColor[6] = () => { pushBRG(b2, r2, g2) }; // 下面左側外側
addColor[7] = () => { pushBRG(b1, r1, g1) }; // 下面右側外側
addColor[8] = () => { pushBRG(b2, r2, g2) }; // 下面右側
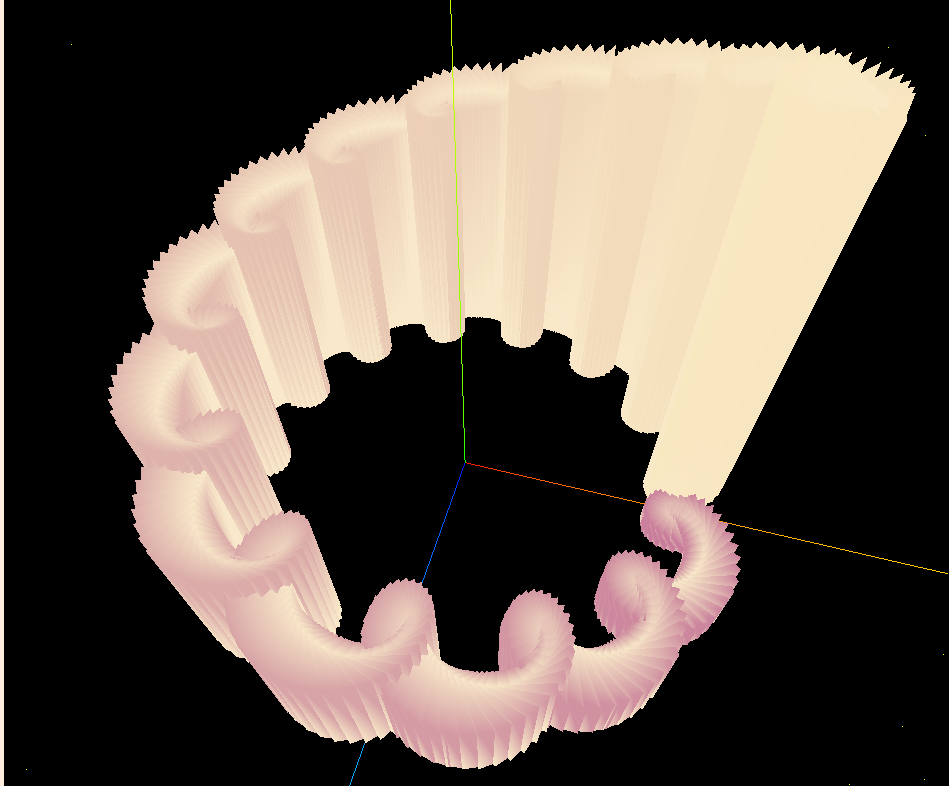
完成以上步驟後,我們就得到了一個旋轉的階梯囉!
接下來,我們要開放使用者調整參數,方便調試,為了做到這點,在輸入框的 change 事件使用這個函式:
setParameter = (id, value) => {
    const {length, maxHeight} = this.column;
    switch(id){
        case "length":
            this.expandVertices(this.column, value, maxHeight);
            break;
        case "maxHeight":
            this.expandVertices(this.column, length, value);
            break;
        default :
            this.column[id] = value;
            this.expandVertices(this.column, length, maxHeight);
    }
}
也因為這個函式很完整,調整其他參數時也可以沿用,分為兩步驟:
第二步驟是我們的重頭戲,我們不只要更新 x y 座標,還要相對應的更新動畫類 path,在這裡我們不使用動畫(相對不好控制,效果也沒有很好),而是直接重置動畫。
    expandVertices(column, newLength, newMaxHeight){
        // 1. 擴充緩衝區
        const {length, radius, maxHeight} = column;
        const vertices = column.geometry.attributes.position.array;
        const color = column.geometry.attributes.color.array;
        const len = vertices.length;

        const newVertices = new Float32Array(newLength * 36 * 3);
        const colorVertices = new Float32Array(newLength * 36 * 3);
        for(let N = 0; N < newLength * 36 * 3 && N < len; N ++){
            newVertices[N] = vertices[N];
            colorVertices[N] = color[N];
        }

        const attribute = new THREE.BufferAttribute(newVertices, 3);
        const colorAttribute = new THREE.BufferAttribute(colorVertices, 3);
        column.geometry.setAttribute('position', attribute);
        column.geometry.setAttribute('color', colorAttribute);

        column.length = newLength;
        column.maxHeight = newMaxHeight;
        // 2. 更新原有的幾何資料和頂點
        for(let N = 0; N < length; N++){
            if(N >= newLength){
                // 如果變短,刪除多餘的幾何資料
                column.geometryData.pop();
                continue;
            }
            const data = column.geometryData[N];
            const angle = (N / newLength) * Math.PI * 2;
            data.x = radius * Math.cos(angle);
            data.y = radius * Math.sin(angle);
            data.height = data.height * length / newLength;
            if(data.height > maxHeight) data.height = maxHeight;
            data.height*= newMaxHeight / maxHeight;

            data.path.ResetTo(data.x, data.y);
            column.updateVertices(N);
        }
        // 如果新長度較長,迭代建立新的幾何資料
        for(let N = length; N < newLength; N++){
            column.geometryData[N] = this.createGeometryData(column, N);
            const data = column.geometryData[N];

            data.path.ResetTo(data.x, data.y);
            column.updateVertices(N);
        }
    }
本文介紹了如何動態更新幾何體的頂點與顏色,並應用於 3D 圓餅圖的渲染。在這個過程中,透過靈活的 BufferGeometry,我們能夠精確控制每個柱體的形狀、顏色和動畫效果。更新頂點數據時,我們先根據索引計算頂點座標,再進行梯度顏色的填充,這樣的設計允許我們實現更具動態感和視覺吸引力的圖形動畫。
這是我們最終的成果,結合了過去幾個篇章的技術,透過不斷優化的資料結構與頂點演算法,從而實現了更加順暢的動畫呈現!
https://jerry-the-potato.github.io/vite-deploy/#Sort3D