昨天我們完成了 API Gateway,讓前端可以透過一個統一的 Proxy 來存取 LLM。
但在真實運行環境裡,還有一個非常現實的問題:
👉 我的系統到底快不快?準不準?花了多少錢?
這就是今天要談的主題:LLM 應用的 Observability(可觀測性)。
一般在後端服務裡,我們會監控:
而在 LLM 應用裡,我們需要額外關心三件事:
延遲(Latency):
Token 使用量:
成本(Cost):
以下是常見的監控指標(Metrics):
| 類別 | 指標 | 說明 |
|---|---|---|
| 效能 | Latency | 每次 API 請求的平均 / P95 / P99 延遲 |
| 成本 | Token Usage | Prompt / Completion / Total |
| 成本 | Cost | 換算成美金(依照模型單價) |
| 穩定性 | Error Rate | 請求失敗率,是否超時或 API 429 |
| 使用情境 | User Query 分佈 | 哪些問題最常被問,幫助改善 Cache 設計 |
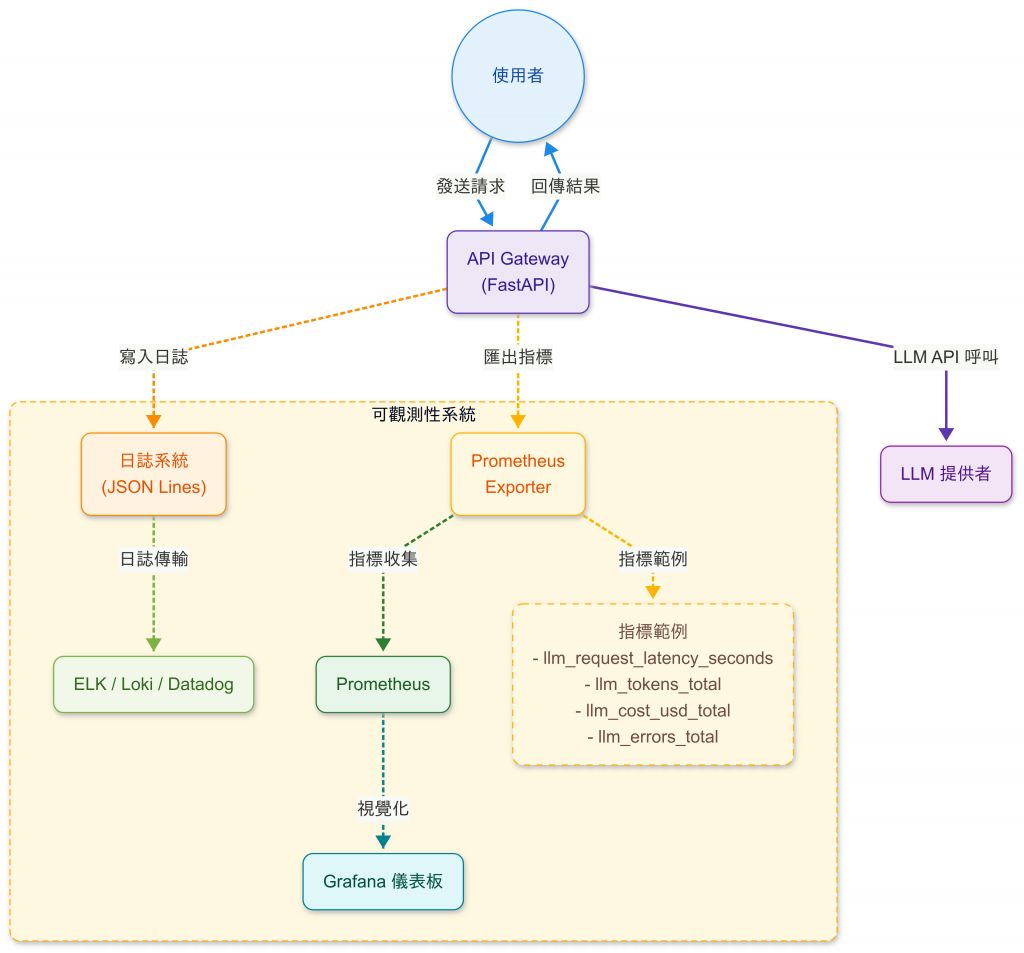
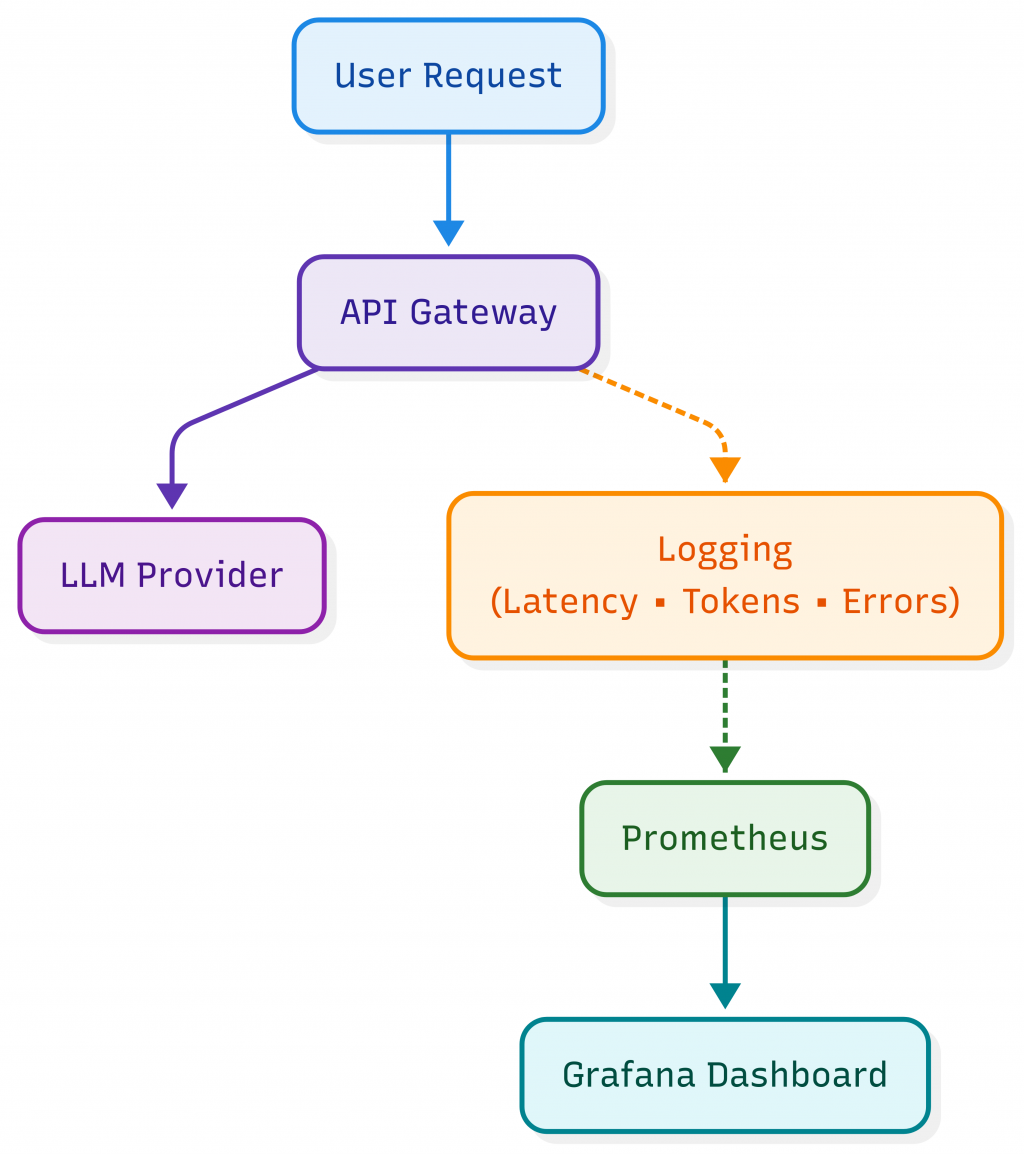
在 API Gateway(FastAPI)層,我們不只是單純攔截,而是在 /ask 端點裡直接記錄:
@app.post("/ask")
async def ask(request: Request):
    body = await request.json()
    model = body.get("model", DEFAULT_MODEL)
    messages = body.get("messages") or [{"role": "user", "content": "Say hello!"}]
    messages = [{"role": "system", "content": "請一律使用繁體中文回答。"}] + messages

    start = time.time()
    try:
        usage_prompt = usage_completion = 0
        answer_text = None

        # 呼叫 OpenAI API (Responses API 或 Chat Completions API)
        resp = client.responses.create(
            model=model,
            input=[{"role": m["role"], "content": m["content"]} for m in messages],
            temperature=body.get("temperature", 0.2),
        )
        answer_text = (resp.output_text or "").strip()
        if resp.usage:
            usage_prompt     = getattr(resp.usage, "input_tokens", 0) or 0
            usage_completion = getattr(resp.usage, "output_tokens", 0) or 0

        latency = time.time() - start
        cost = calc_cost(model, usage_prompt, usage_completion)

        # ===== Logging =====
        logger.info(
            f"LLM Request | model={model} latency={latency:.2f}s "
            f"prompt_tokens={usage_prompt} completion_tokens={usage_completion} cost={cost:.6f}"
        )

        return {
            "model": model,
            "latency_s": round(latency, 3),
            "prompt_tokens": usage_prompt,
            "completion_tokens": usage_completion,
            "cost_usd": round(cost, 6),
            "answer": answer_text,
        }
time.time() 量測請求時間usage 抓取calc_cost() 換算成美元⚠️ 為了符合隱私合規性:日誌不會存原始 user prompt;若需稽核改存 hash/抽樣。
Prometheus 提供 Counter / Histogram ,方便收集:
from prometheus_client import Counter, Histogram, generate_latest, CONTENT_TYPE_LATEST

REQUEST_COUNT = Counter("llm_requests_total", "Total LLM requests", ["model"])
TOKEN_USAGE = Counter("llm_tokens_total", "Total tokens used", ["model", "type"])
LATENCY = Histogram("llm_request_latency_seconds", "LLM request latency", ["model"])
ERROR_COUNT = Counter("llm_errors_total", "Total LLM errors", ["model", "error_type"])
COST = Counter("llm_cost_usd_total", "Total cost (USD)", ["model"])
配合 Grafana Dashboard,我們就能看到:
⚠️ 注意:single process(uvicorn --reload False)可直接使用上述寫法;若要在 multi-process(如 gunicorn -w 4) 部署,請改用 prometheus_client.multiprocess.Registry(範例如下),避免指標重複。
import os
from prometheus_client import CollectorRegistry, multiprocess, generate_latest

if os.environ.get('PROMETHEUS_MULTIPROC_DIR'):
    # Multi-process mode
    registry = CollectorRegistry()
    multiprocess.MultiProcessCollector(registry)
else:
    # Single process mode (開發環境)
    from prometheus_client import REGISTRY as registry
⚠️ 定價來源與命名說明
下方PRICING僅作示例,請以官方定價頁為準;實際價格可能因地區、企業折扣、方案不同而變動。 文中不使用「未公布或已下架」的型號名稱,避免混淆。上線前請再次核對你實際用到的模型。(本文撰寫於 2025-10-03,表為當日定價)
以 OpenAI GPT-4o-mini 為例:
| 供應商 | 模型(建議名稱) | Input / 1M | Output / 1M | 備註 / 來源 |
|---|---|---|---|---|
| OpenAI | GPT-4o | $2.50 | $10.00 | 官方模型頁(一般用於 Responses/Chat)(OpenAI Platform) |
| OpenAI | GPT-4o-mini | $0.15 | $0.60 | 官方 API 定價頁(Realtime API—Text 區塊);若非 Realtime,仍以此頁為準核價。(OpenAI) |
| Anthropic | Claude Sonnet 4.5 | $3.00 | $15.00 | 官方公告:「4.5 與 Sonnet 4 同價」(Anthropic) |
| Anthropic | Claude 3.5 Haiku | $0.80 | $4.00 | 官方 Haiku 定價說明(3.5)(Anthropic) |
| Anthropic | Claude Opus 4.1 | $15.00 | $75.00 | 官方 Opus 4.1 頁/定價文件 (Anthropic) |
我們可以在 Logging 裡直接加一個小函式:
PRICING = {
    "gpt-4o":      {"prompt": 2.50/1_000_000, "completion": 10.00/1_000_000},
    "gpt-4o-mini": {"prompt": 0.15/1_000_000, "completion": 0.60/1_000_000},
    "gpt-4.1":     {"prompt": 2.00/1_000_000, "completion": 8.00/1_000_000},
    "gpt-4.1-mini":{"prompt": 0.40/1_000_000, "completion": 1.60/1_000_000},
}

def calc_cost(model: str, prompt_tokens: int, completion_tokens: int) -> float:
    p = PRICING.get(model)
    if not p:
        return 0.0
    return prompt_tokens * p["prompt"] + completion_tokens * p["completion"]
每次請求都記錄成本,最後就可以匯總成報表。
今天的程式碼會放在 GitHub Repo,有興趣的讀者歡迎自行Fork研究
day19_observability/
├─ app/
│  ├─ app.py              # FastAPI + Prometheus exporter
│  ├─ requirements.txt
│  └─ Dockerfile
├─ tests/
│  └─ test_requests.py    # 測試腳本
├─ docker/
│  ├─ prometheus.yml
│  └─ grafana/
│     └─ provisioning/
│        ├─ dashboards/
│        │  ├─ dashboard.yml
│        │  └─ llm_observability.json
│        └─ datasources/
│           └─ datasource.yml
├─ environment.yml        # Conda 環境設定
├─ .env                   # 環境變數 (不要上傳)
├─ .env.example           # 環境變數範例
├─ docker-compose.yml
├─ README.md
└─ .dockerignore
這是一個最小可行的 LLM Observability 範例專案,透過 Flask API 包裝 OpenAI,並輸出 Prometheus Metrics,最後用 Grafana Dashboard 視覺化。我已經將 App 連帶 Prometheus 以及 Grafana 都打包了,只要透過 docker-compose 就可以全部啟動,請參考 GitHub Repo 裡的 README.md 啟動專案。
執行手動測試打 requests:
❯ curl -X POST http://localhost:8000/ask \
  -H 'Content-Type: application/json' \
  -d '{"model":"gpt-4.1","messages":[{"role":"user","content":"請簡短的介紹台灣?"}]}'
{"model": "gpt-4.1", "latency_s": 2.455, "prompt_tokens": 28, "completion_tokens": 77, "cost_usd": 0.000672, "answer": "台灣位於東亞,四面環海,首都是台北。擁有2300多萬人口,以高科技產業、豐富美食和多元文化聞名。自然景觀多樣,包括高山、溫泉和美麗海岸。台灣是亞洲重要的經濟體,也是民主社會。"}

❯ curl -X POST http://localhost:8000/ask \
  -H 'Content-Type: application/json' \
  -d '{"model":"gpt-4o-mini","messages":[{"role":"user","content":"用三點解釋 RAG"}]}'
{"model": "gpt-4o-mini", "latency_s": 6.012, "prompt_tokens": 28, "completion_tokens": 195, "cost_usd": 0.000121, "answer": "RAG(Retrieval-Augmented Generation)是一種結合檢索和生成的模型,主要用於自然語言處理。以下是三個要點解釋 RAG:\n\n1. **檢索與生成結合**:RAG 模型首先從外部資料庫中檢索相關信息,然後將這些信息與生成模型結合,生成更具上下文和準確性的回答。\n\n2. **提高準確性**:透過檢索最新或專業的資料,RAG 能夠提供比單純生成模型更準確和具體的回答,特別是在面對需要最新資訊的問題時。\n\n3. **應用廣泛**:RAG 可應用於各種任務,如問答系統、對話生成和內容創作等,特別適合需要大量背景知識的場景。"}
也可以執行腳本測試:
❯ python tests/test_requests.py
✅ gpt-4o-mini 回答:「成功不是終點,失敗不是致命的,重要的是繼續前行的勇氣。」... (tokens=29+25, cost=1.9e-05$)
✅ gpt-4o-mini 回答:RAG(Retrieval-Augmented Generation)是一種結合... (tokens=27+72, cost=4.7e-05$)
✅ gpt-4o 回答:在金融業中,RAG(紅、黃、綠)系統是一種常見的風險管理和績效評估工具。這種系統... (tokens=29+395, cost=0.004023$)

📊 Metrics 部分輸出:
# HELP llm_requests_total Total LLM requests
# TYPE llm_requests_total counter
llm_requests_total{model="gpt-4o-mini"} 9.0
llm_requests_total{model="gpt-4o"} 2.0
llm_requests_total{model="gpt-4.1"} 1.0
# HELP llm_tokens_total Total tokens used
# TYPE llm_tokens_total counter
llm_tokens_total{model="gpt-4o-mini",type="prompt"} 265.0
llm_tokens_total{model="gpt-4o-mini",type="completion"} 435.0
llm_tokens_total{model="gpt-4o",type="prompt"} 57.0
llm_tokens_total{model="gpt-4o",type="completion"} 641.0
llm_tokens_total{model="gpt-4.1",type="prompt"} 28.0
llm_tokens_total{model="gpt-4.1",type="completion"} 77.0
# HELP llm_cost_usd_total Total cost (USD)
# TYPE llm_cost_usd_total counter
llm_cost_usd_total{model="gpt-4o-mini"} 0.00030075
llm_cost_usd_total{model="gpt-4o"} 0.006552500000000001
llm_cost_usd_total{model="gpt-4.1"} 0.000672
執行 curl http://localhost:8000/metrics | head -50 可以得到部分 metrics:
# HELP python_gc_objects_collected_total Objects collected during gc
# TYPE python_gc_objects_collected_total counter
python_gc_objects_collected_total{generation="0"} 1885.0
python_gc_objects_collected_total{generation="1"} 249.0
python_gc_objects_collected_total{generation="2"} 0.0
# HELP python_gc_objects_uncollectable_total Uncollectable objects found during GC
# TYPE python_gc_objects_uncollectable_total counter
python_gc_objects_uncollectable_total{generation="0"} 0.0
python_gc_objects_uncollectable_total{generation="1"} 0.0
python_gc_objects_uncollectable_total{generation="2"} 0.0
# HELP python_gc_collections_total Number of times this generation was collected
# TYPE python_gc_collections_total counter
python_gc_collections_total{generation="0"} 227.0
python_gc_collections_total{generation="1"} 20.0
python_gc_collections_total{generation="2"} 1.0
# HELP python_info Python platform information
# TYPE python_info gauge
python_info{implementation="CPython",major="3",minor="11",patchlevel="13",version="3.11.13"} 1.0
# HELP process_virtual_memory_bytes Virtual memory size in bytes.
# TYPE process_virtual_memory_bytes gauge
process_virtual_memory_bytes 8.4549632e+07
# HELP process_resident_memory_bytes Resident memory size in bytes.
# TYPE process_resident_memory_bytes gauge
process_resident_memory_bytes 7.0643712e+07
# HELP process_start_time_seconds Start time of the process since unix epoch in seconds.
# TYPE process_start_time_seconds gauge
process_start_time_seconds 1.75759896776e+09
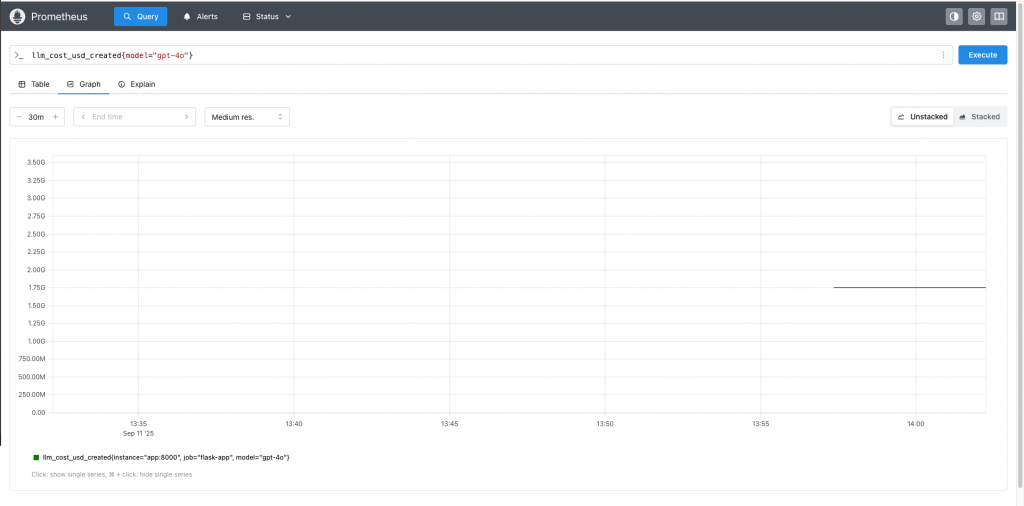
到瀏覽器輸入:http://localhost:9090/,可以看到 prometheus dashboard:
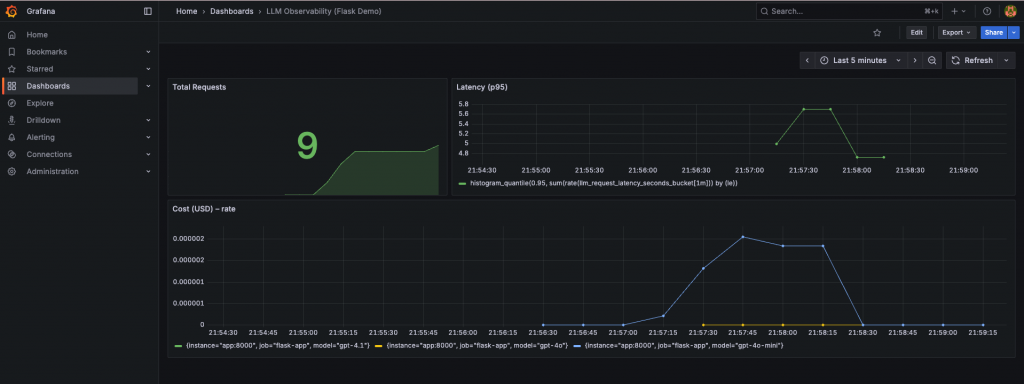
到瀏覽器輸入:http://localhost:3000/,可以看到 Grafana dashboard:
log 寫到 logs/llm_requests.log,未來也能整合到 ELK / Loki / Datadog。
2025-09-11 16:30:17,178 [INFO] LLM Request | model=gpt-4o-mini latency=1.89s prompt_tokens=21 completion_tokens=14 cost=0.000012
2025-09-11 16:30:17,180 [INFO] [HEALTH] ok
2025-09-11 16:30:27,243 [INFO] [HEALTH] ok
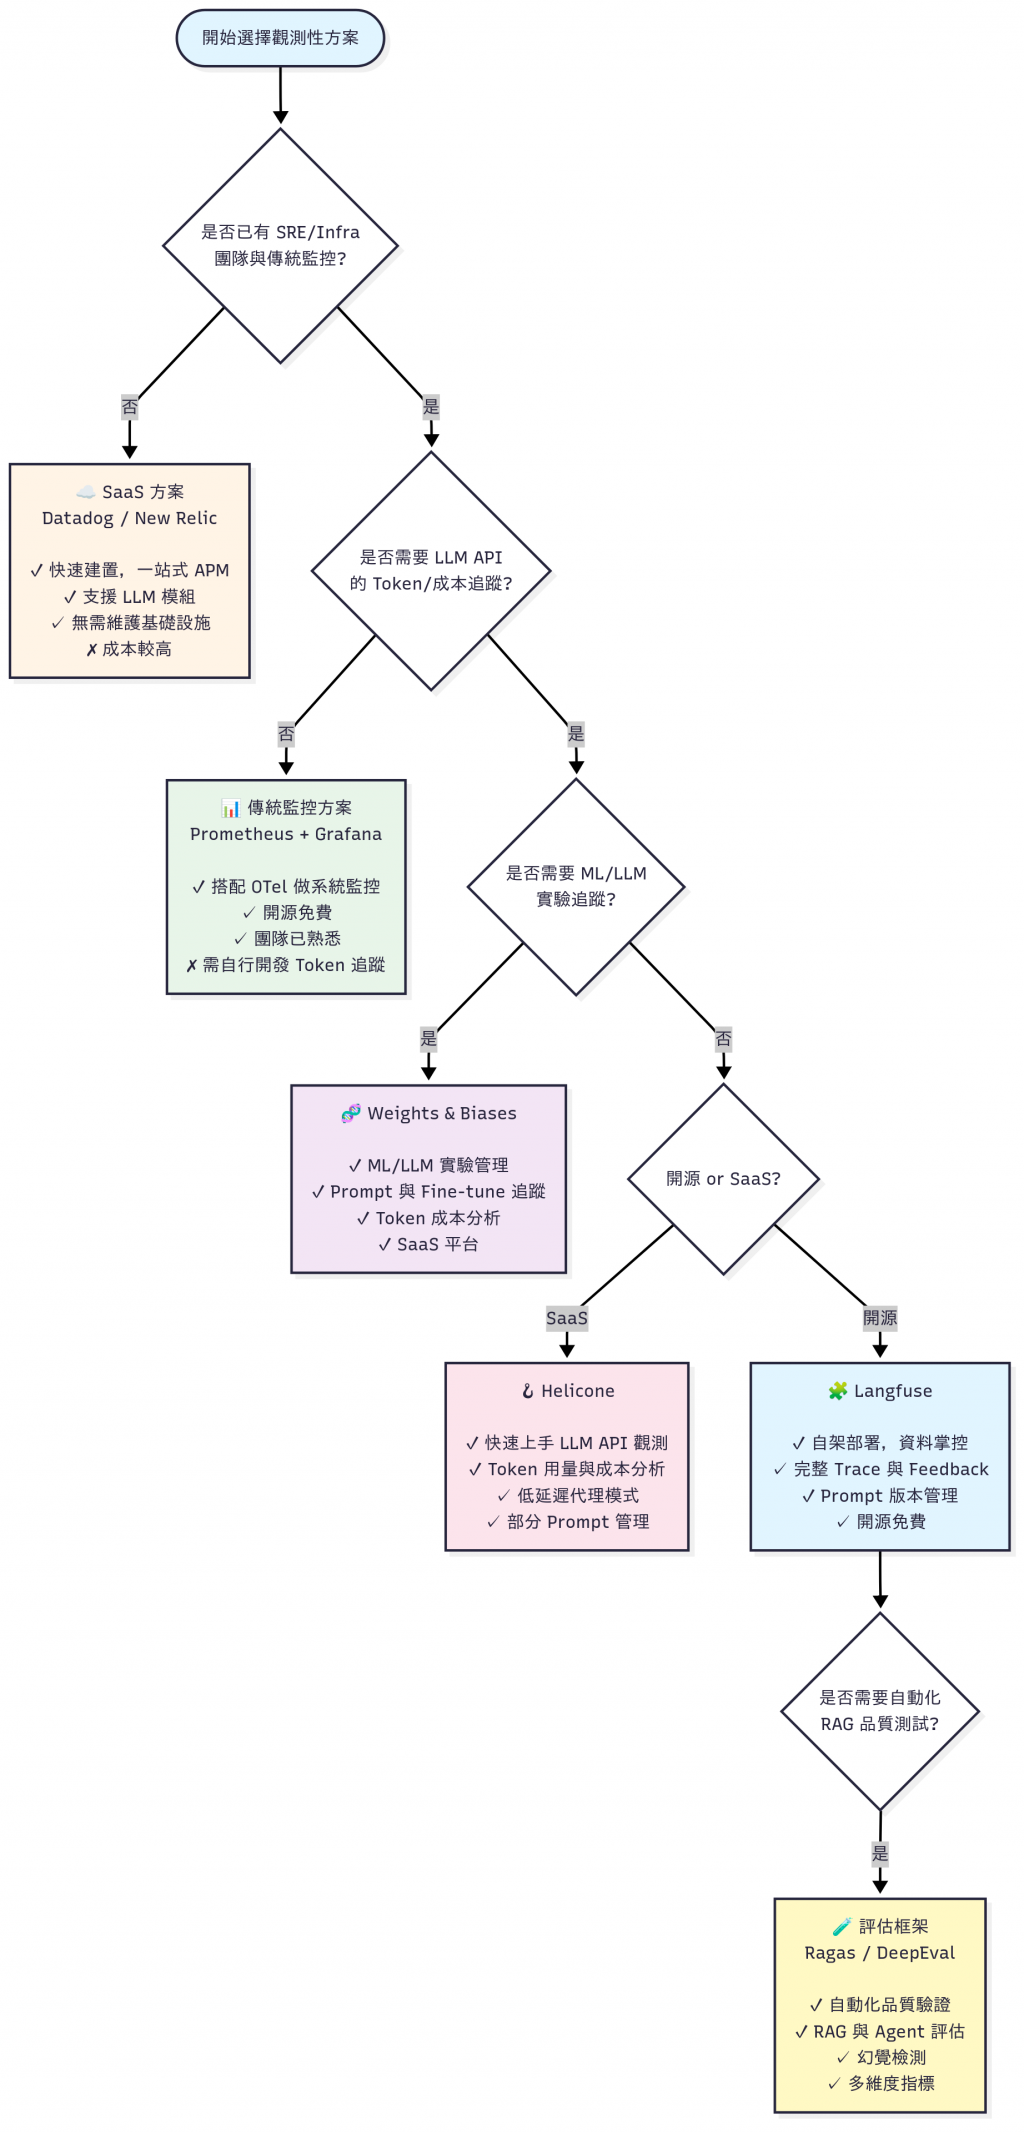
這邊列出了三個報表:
| 類型 | 工具 | 適合誰 | 特色 |
|---|---|---|---|
| 基礎監控 | Prometheus + Grafana | DevOps / SRE | 開源標配,metrics + dashboard |
| 雲端套件 | Datadog / New Relic | 有錢的公司 | 一站式 APM,快速上線 |
| LLM API 觀測 | Helicone / Langfuse | LLM 初創團隊 | Token 成本、trace、feedback |
| 實驗追蹤 | Weights & Biases | ML 團隊 | Prompt / fine-tune 實驗管理 |
| 品質評估 | Ragas / DeepEval | RAG 開發者 | 自動化測試、回答品質驗證 |
| 功能面向 | Prometheus | Grafana | Helicone | Langfuse | W&B | Ragas | DeepEval |
|---|---|---|---|---|---|---|---|
| Metrics | ✅ | ✅ | ✅ | ✅ | ✅ ML 支援完整 | ❌ | ❌ |
| Tracing | OTel 整合 | ✅ | ✅ | ✅ | ✅ | ❌ | ✅ |
| Token 成本 | ❌ | ❌ | ✅ | ✅ | ✅ | ❌ | ❌ |
| Prompt 管理 | ❌ | ❌ | 部分 | ✅ | ✅ | ❌ | ❌ |
| 品質評估 | ❌ | ❌ | ❌ | ✅ (Feedback) | ✅ | ✅ | ✅ |
| 開源 / SaaS | 開源 | 開源 | SaaS+開源 | 開源 | SaaS | 開源 | 開源 |
| 適用場景 | Infra | 可視化 | API log/成本 | LLM pipeline trace | ML/LLM 實驗 | RAG 評估 | RAG+Agent評估 |
今天我們學會了 如何監控 LLM 應用的運行狀態:
有了這些基礎指標,我們在 Debug 問題 與 控制成本 上就能更有信心。但還有一個更關鍵的問題:
🤔 模型回答得很快,但答案是錯的怎麼辦?
明天(Day 20),我們會深入「品質監控」,特別是 幻覺偵測(Hallucination Detection): 如何判斷模型是不是在胡說八道?
我們明天見!有興趣的話,歡迎追蹤系列文 ⭐