上次我們下載安裝了Grafana和Prometheus要來監控Ollama LLM 的運行狀況,今天我們使用Docker compose的方式來把整個服務啟動起來,會用到的架構如下:
需要的套件
pip install prometheus-client ollama
下面提供一支簡單的監控腳本,執行前要先確認你的ollama是否有正常運行,以及你要監控的模型服務名稱,例如筆者的model_name="cwchang/llama-3-taiwan-8b-instruct:latest"。
from prometheus_client import Counter, Histogram, start_http_server
import ollama
import time

# 定義 Prometheus 指標
llm_requests_total = Counter(
    'llm_requests_total',
    'Total number of LLM requests',
    ['model', 'status']
)

llm_response_time = Histogram(
    'llm_response_time_seconds',
    'LLM response time in seconds',
    ['model']
)

llm_tokens_total = Counter(
    'llm_tokens_total',
    'Total number of tokens processed',
    ['model', 'type']  # type: prompt 或 completion
)

print("✅ Metrics defined successfully!")

def call_ollama(prompt, model_name="cwchang/llama-3-taiwan-8b-instruct:latest"):
    """調用 Ollama 並記錄指標"""
    start_time = time.time()
    status = "success"

    try:
        response = ollama.chat(
            model=model_name,
            messages=[{'role': 'user', 'content': prompt}]
        )

        # 記錄回應時間
        duration = time.time() - start_time
        llm_response_time.labels(model=model_name).observe(duration)

        # 記錄成功的請求
        llm_requests_total.labels(model=model_name, status=status).inc()

        # 如果有 token 資訊,也記錄下來
        if hasattr(response, 'prompt_eval_count'):
            llm_tokens_total.labels(model=model_name, type='prompt').inc(response.prompt_eval_count)
        if hasattr(response, 'eval_count'):
            llm_tokens_total.labels(model=model_name, type='completion').inc(response.eval_count)

        return response.message.content

    except Exception as e:
        status = "error"
        llm_requests_total.labels(model=model_name, status=status).inc()
        print(f"❌ Error: {e}")
        return None

# 啟動 Prometheus metrics server
print("🚀 Starting Prometheus metrics server on port 8000...")
start_http_server(8000)

# 測試調用
print("\n📝 測試 LLM 調用...")
result = call_ollama("你好,請用一句話介紹台灣")
print(f"✅ 回應: {result}")

print("\n🎯 Metrics server is running at http://localhost:8000")
print("按 Ctrl+C 停止...")

# 保持程式運行
try:
    while True:
        time.sleep(1)
except KeyboardInterrupt:
    print("\n👋 Stopping server...")
今天目的是先要讓監控能啟動,所以我們只先監控下面三個指標:
version: '3.8'

services:
  prometheus:
    image: prom/prometheus:latest
    container_name: prometheus
    ports:
      - "9091:9090"
    volumes:
      - ./prometheus.yml:/etc/prometheus/prometheus.yml
      - prometheus_data:/prometheus
    command:
      - '--config.file=/etc/prometheus/prometheus.yml'
      - '--storage.tsdb.path=/prometheus'
    networks:
      - monitoring

  grafana:
    image: grafana/grafana:latest
    container_name: grafana
    ports:
      - "3001:3000"
    environment:
      - GF_SECURITY_ADMIN_PASSWORD= 你的Grafana密碼
      - GF_SECURITY_ADMIN_USER=admin
    volumes:
      - grafana_data:/var/lib/grafana
    networks:
      - monitoring
    depends_on:
      - prometheus

volumes:
  prometheus_data:
  grafana_data:

networks:
  monitoring:
    driver: bridge
global:
  scrape_interval: 15s  # 每 15 秒抓取一次數據
  evaluation_interval: 15s

scrape_configs:
  - job_name: 'ollama_monitor'
    static_configs:
      - targets: ['host.docker.internal:8000']  # Ollama 監控服務地址
# 1. 確保你的 ollama_monitor.py 還在運行
# 如果沒有,重新執行:
python ollama_monitor.py

# 2. 在另一個終端機啟動 Prometheus 和 Grafana
docker-compose up -d

# 3. 檢查服務狀態
docker-compose ps
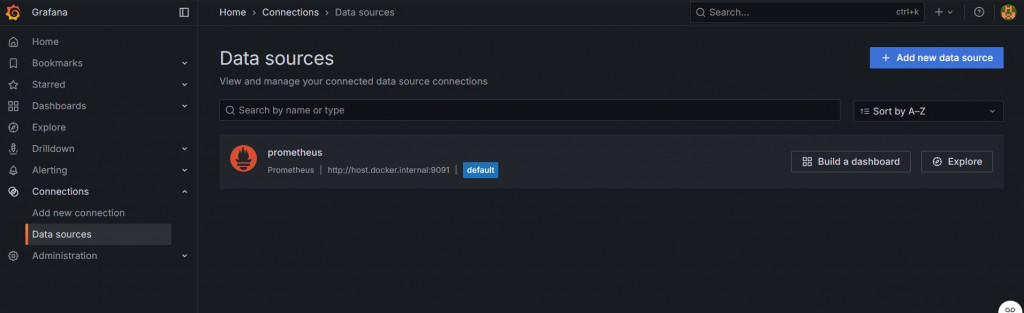
首先我們要先進入Grafana的首頁:http://localhost:3000/
在左側可以看到Connections,往內有一個Datasources,進入後點選Prometheus
在setting的部分有一個connection,在裡面輸入http://host.docker.internal:9091
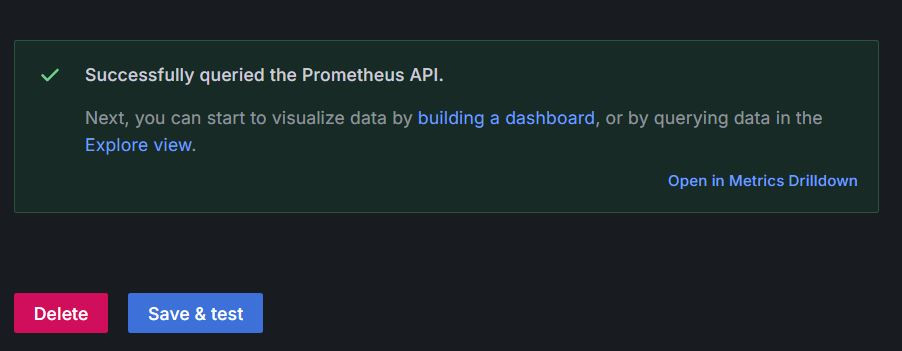
並在最下面點選 Save & test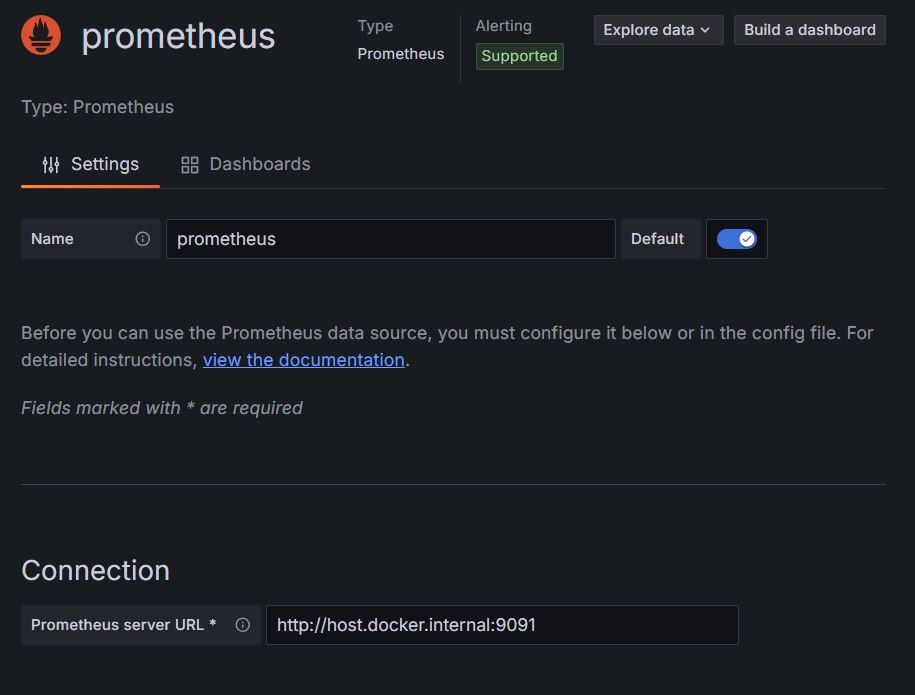
看到**Successfully quired the Prometheus API.**就代表我們連接成功囉!
這樣我們就先把Grafana連動起來,大概的系統架構如下
┌─────────────────┐
│  Ollama API     │ (port 11434)
│  LLM 服務       │
└────────┬────────┘
         │
         ↓ 調用
┌─────────────────┐
│ ollama_monitor  │ (port 8000)
│ Python 監控程式 │ ← 暴露 /metrics
└────────┬────────┘
         │
         ↓ 抓取指標
┌─────────────────┐
│  Prometheus     │ (port 9090)
│  指標收集       │
└────────┬────────┘
         │
         ↓ 查詢數據
┌─────────────────┐
│   Grafana       │ (port 3000)
│   視覺化展示    │
└─────────────────┘
明天我們繼續調整監控指標,確保監控的是我們要的資訊!


 iThome鐵人賽