前幾天的文章已經說明了Grafana和Prometheus的基本運用,今天我們試著新增一個 Streamlit 介面來調用 Ollama,並將相關 metrics 加入監控。
我們還是做前後端分離,streamlit只負責前端,API調用和Metrics我們另外寫另外放,後面比較好管理。
project/
├── app.py              # Streamlit 主程式
├── api.py              # API 與 Metrics 定義
└── requirements.txt    # 依賴套件
這段是調用ollama的重點,注意在避免重複註冊的輔助函數這段,如果沒做這個動作,會因為Streamlit 每次重新運行時會重複註冊 Prometheus metrics而導致錯誤 ValueError: Duplicated timeseries 。
import ollama
import time
from prometheus_client import Counter, Histogram, Gauge, generate_latest, REGISTRY

# 避免重複註冊的輔助函數
def get_or_create_counter(name, description, labelnames=None):
    try:
        return REGISTRY._names_to_collectors[name]
    except KeyError:
        return Counter(name, description, labelnames or [])

def get_or_create_histogram(name, description):
    try:
        return REGISTRY._names_to_collectors[name]
    except KeyError:
        return Histogram(name, description)

def get_or_create_gauge(name, description):
    try:
        return REGISTRY._names_to_collectors[name]
    except KeyError:
        return Gauge(name, description)

# 定義 Prometheus Metrics
REQUEST_COUNT = get_or_create_counter(
    'llm_requests_total',
    'Total LLM requests',
    ['status']
)
REQUEST_DURATION = get_or_create_histogram(
    'llm_request_duration_seconds',
    'LLM request duration'
)
ACTIVE_REQUESTS = get_or_create_gauge(
    'llm_active_requests',
    'Active LLM requests'
)

def call_ollama(prompt: str, model: str = "llama2") -> str:
    """調用 Ollama 並記錄 metrics"""
    ACTIVE_REQUESTS.inc()
    start_time = time.time()

    try:
        response = ollama.chat(
            model=model,
            messages=[{'role': 'user', 'content': prompt}]
        )

        REQUEST_COUNT.labels(status='success').inc()
        return response['message']['content']

    except Exception as e:
        REQUEST_COUNT.labels(status='error').inc()
        raise e

    finally:
        duration = time.time() - start_time
        REQUEST_DURATION.observe(duration)
        ACTIVE_REQUESTS.dec()

def get_metrics():
    """返回 Prometheus metrics"""
    return generate_latest(REGISTRY)
這段沒有什麼特殊的地方,讀者可以拿來做參考測試,唯需要注意port的部分,streamlit預設8501,如果有衝突需要修改。
import streamlit as st
from api import call_ollama, get_metrics
# 啟動指定port號
try:
    start_http_server(8502)
except:
    pass  # 如果已經啟動就跳過

st.title("🤖 Ollama Chat Interface")

# 側邊欄設定
with st.sidebar:
    st.header("⚙️ 設定")
    model = st.selectbox(
        "選擇模型",
        ["llama2", "cwchang/llama-3-taiwan-8b-instruct:latest"]
    )

    st.divider()
    st.header("📊 Metrics")
    if st.button("顯示 Metrics"):
        st.code(get_metrics().decode('utf-8'))

# 主要對話區
prompt = st.text_area("輸入你的問題:", height=100)

if st.button("送出", type="primary"):
    if prompt:
        with st.spinner("思考中..."):
            try:
                response = call_ollama(prompt, model)
                st.success("回應:")
                st.write(response)
            except Exception as e:
                st.error(f"錯誤:{str(e)}")
    else:
        st.warning("請輸入問題")
昨天的文章我們已經先啟動了一個ollama_monitor,今天我們加入新的監控目標,需要修改prometheus.yaml
global:
  scrape_interval: 15s

scrape_configs:
  # 現有的 Ollama 監控
  - job_name: 'ollama'
    static_configs:
      - targets: ['localhost:11434']

  # 新增:Streamlit App 監控
  - job_name: 'streamlit_app'
    static_configs:
      - targets: ['localhost:8502']
    metrics_path: '/metrics'
更新完後進行重啟
docker-compose restart prometheus
如果成功的話,在prometheus的Status → Targets頁面可以檢視到新增的streamlit_llm 的狀態是 UP(綠色),這樣就把監控加入囉!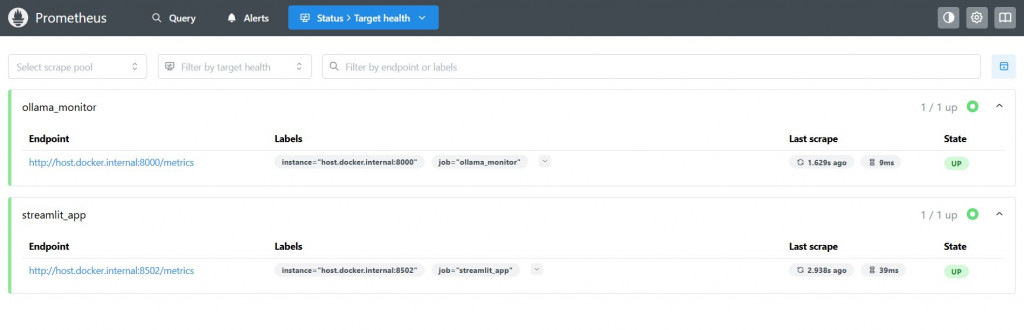
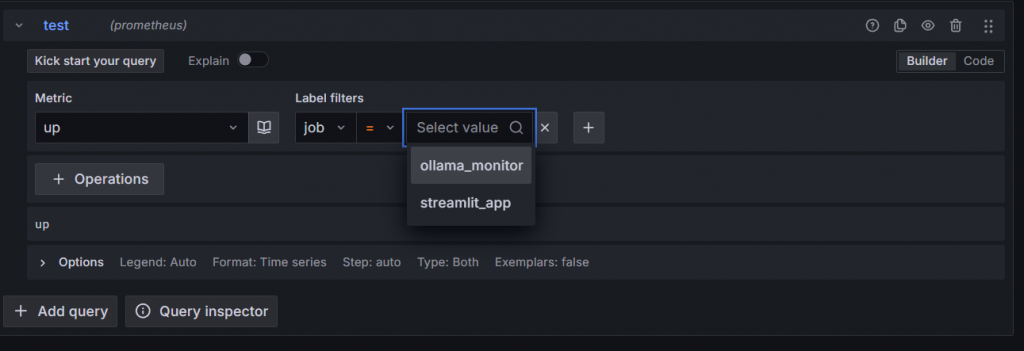
也可以在Grafana 的explore頁面檢查到有新的Job,確定都有連接上!
以上就是今天的整理,剩下兩天的希望至少能把Agentic RAG順利起起來加入監控....


 iThome鐵人賽