昨天我們學會了 Pandas 的靈魂角色 — Series 和 DataFrame,
你應該已經感受到 Pandas 在處理資料時的「高效率 + 優雅」。
但光會建立資料還不夠,真正的資料分析可不是自己打幾筆數字玩玩而已。
現實世界裡的資料,通常都藏在一個又一個 .csv 檔案中,
裡面充滿缺值、錯字、重複資料、亂七八糟的欄位名稱
(沒錯,就是那種會讓你崩潰的 Excel)。
今天,我們來實戰演練!
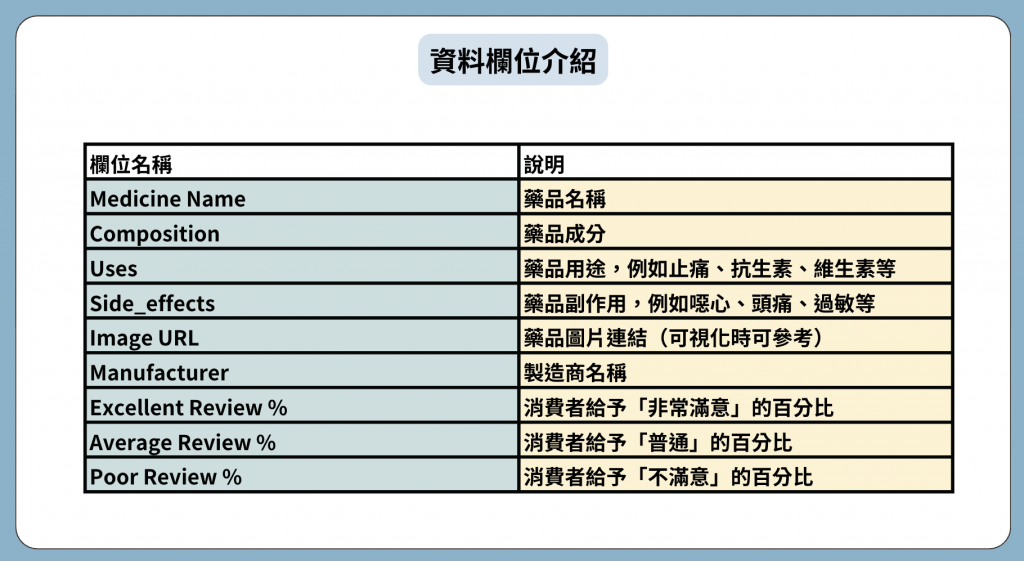
我們要分析的 CSV 檔案包含 11000 種藥品(檔案是從Kaggle下載的),
先來看看欄位介紹:
讀取 CSV 檔案並轉換為 DataFrame,是資料分析的第一步。
import pandas as pd

df = pd.read_csv("medicine.csv")  # 匯入資料
print(df.head())  # 看前五筆資料
輸出: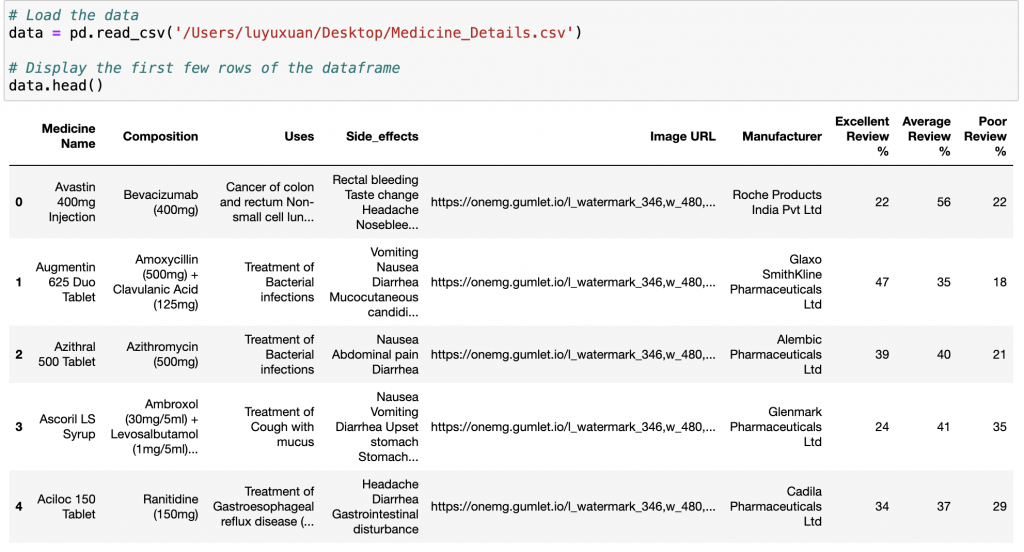
用途:查看前 n 筆資料(預設 5)。
回傳:DataFrame(前 n 列)
可搭配 df.tail() 查看檔尾,快速檢查欄位與資料長相。
進階讀取方式(處理亂碼、分隔符號或缺值):
df = pd.read_csv("medicine.csv", encoding="utf-8", sep=",", na_values=["N/A", "NaN"])
常見參數:
encoding(例:'utf-8' / 'utf-8-sig' / 'cp950')sep(分隔符號,預設 ',')header(指定表頭列,預設 0)index_col(把哪個欄位當索引)na_values(哪些值視為缺值)接下來!我們要來進入一連串的資料分析囉!!
df.info()data.info()
查看資料結構、每欄的型別與遺漏值數量。
(這在你剛讀完 CSV 想快速了解資料時非常實用。)
輸出: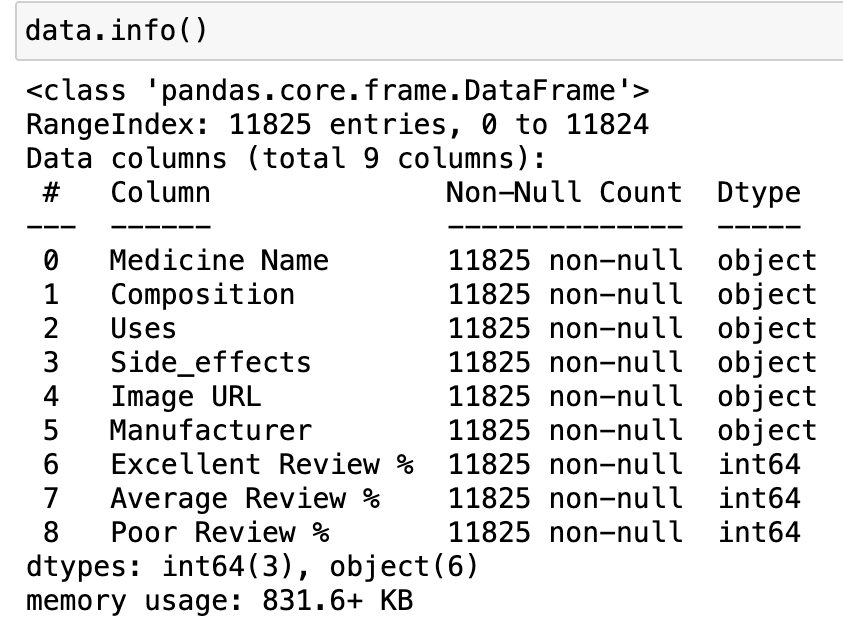
df.describe()用途:數值型欄位的統計摘要(count, mean, std, min, 25%, 50%, 75%, max)。
回傳:DataFrame(摘要)
df.describe()
輸出: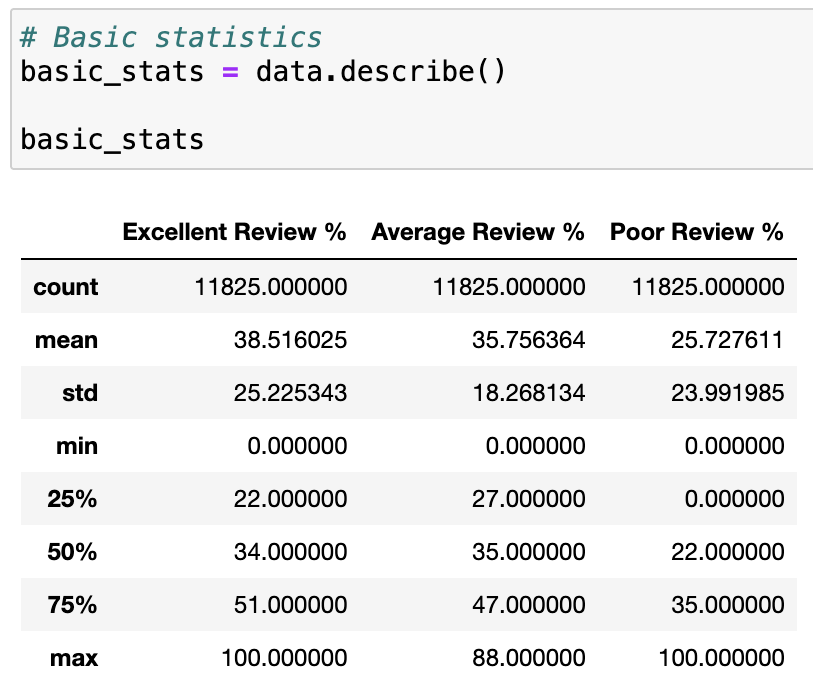
加上 include='all' 可以連文字欄位一起統計。
# Basic statistics
basic_stats = data.describe(include="all")

basic_stats
輸出: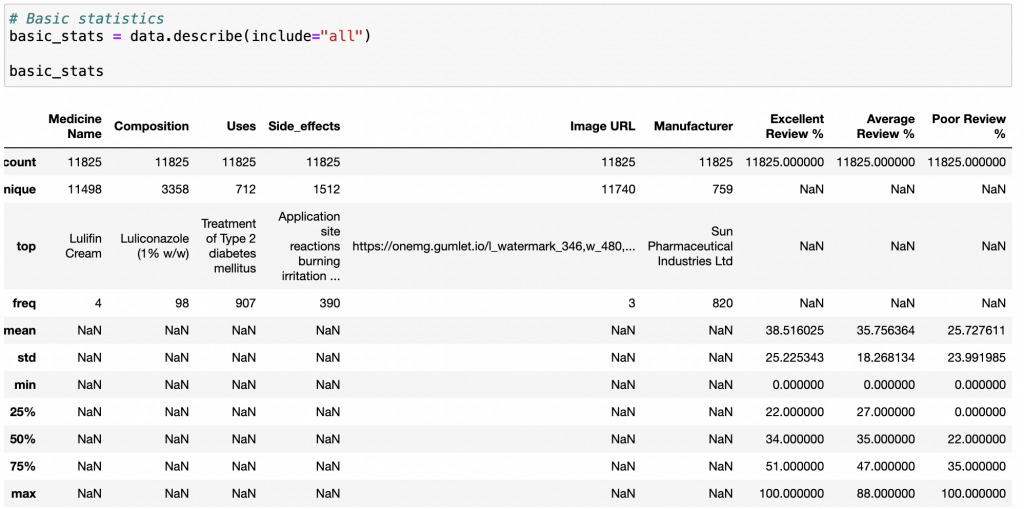
df.isnull()檢查缺失值(True 代表缺失)
# Check for missing values
missing_values = data.isnull().sum()

missing_values
輸出: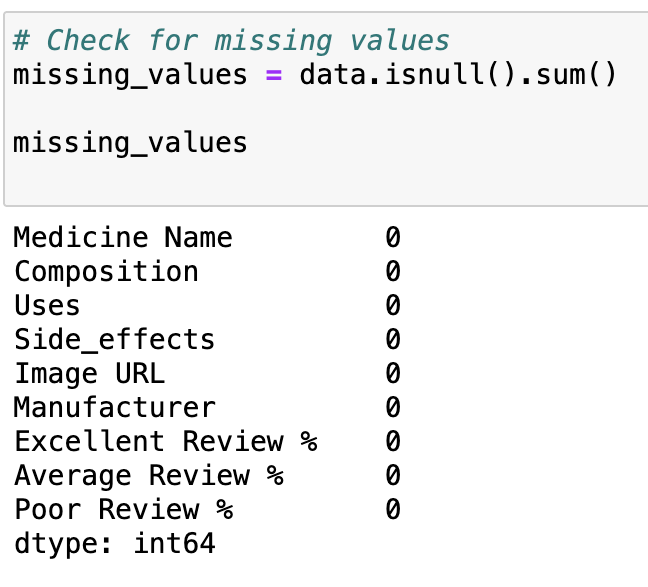
df.duplicated() — 檢查重複資料duplicated() 用來檢查 DataFrame 中是否有重複的列。
它會回傳一個布林(True/False)序列,True 表示該行與前面某行內容完全相同。
下面的語法是計算重複資料的「總和數量」。
# Checking for duplicate entries
data.duplicated().sum()
輸出: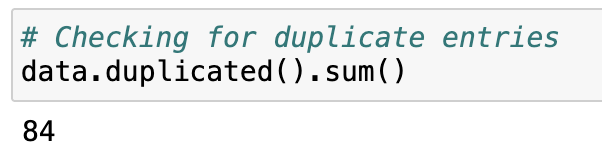
df.drop_duplicates()— 刪除重複資料#drop duplicate刪除重複的資料
data = data.drop_duplicates()
data.duplicated().sum()
輸出: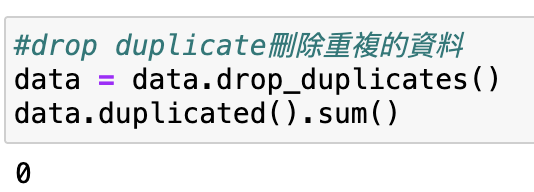
df.iloc() — 用「位置」選資料.iloc()函式用於根據索引選擇row和column
data.iloc[0] # 選擇第一row
輸出: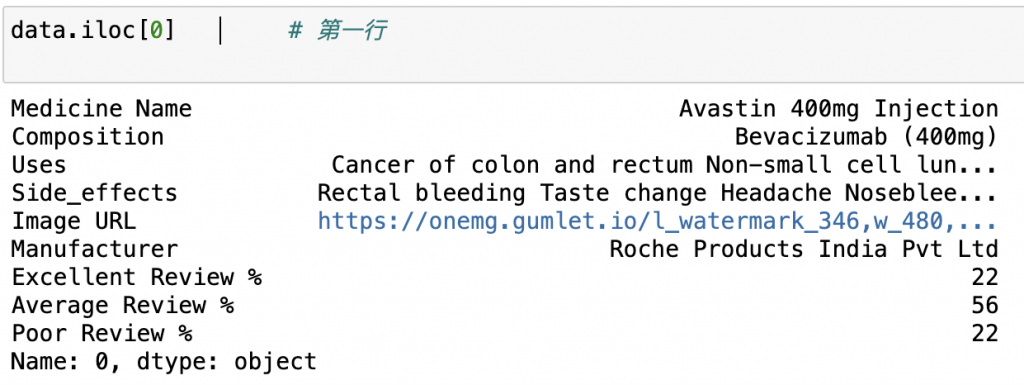
data.iloc[:2] # 前兩cols
輸出: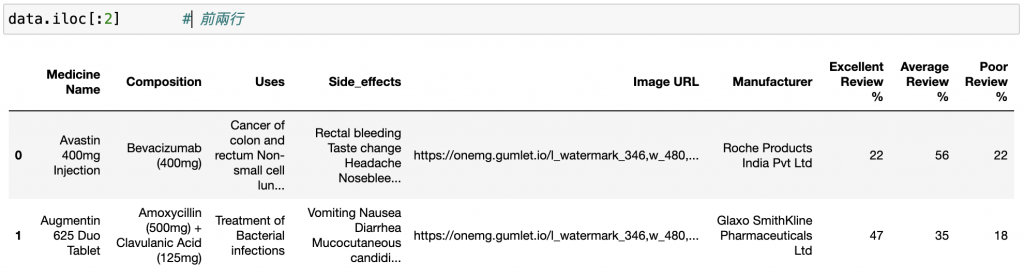
df.loc() — 用「標籤」選資料基於標籤名稱(欄位名稱或索引名)的選取。
data.loc[:,"Side_effects"]
輸出: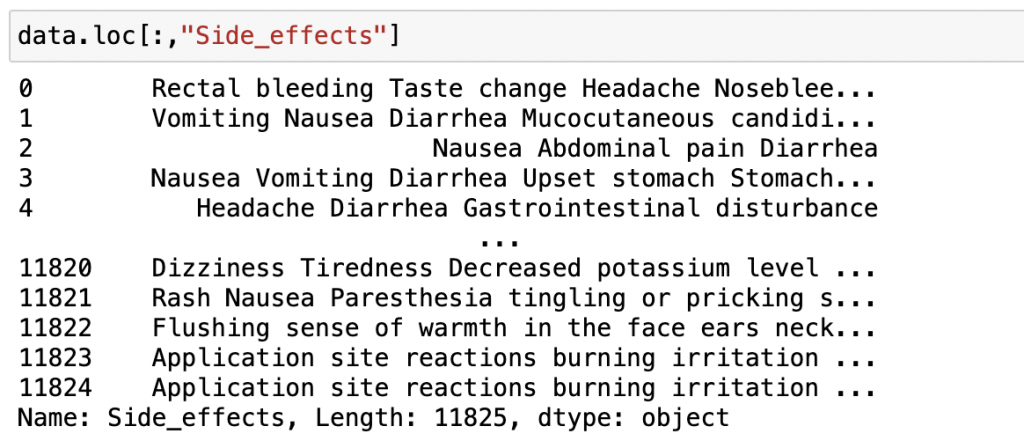
也可以篩選不只一種標籤的資料喔!
data.loc[:, ['Medicine Name',"Side_effects"]]
輸出: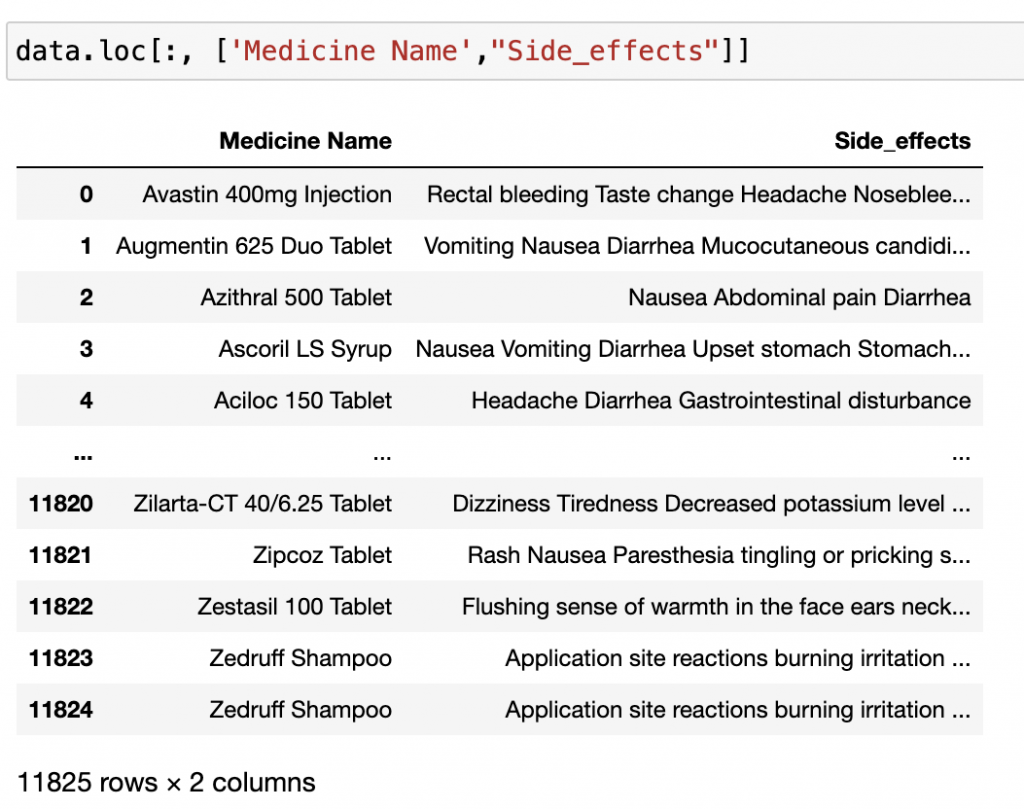
假設要篩選出Average Review > 80:
data[data['Average Review %']>80]
輸出: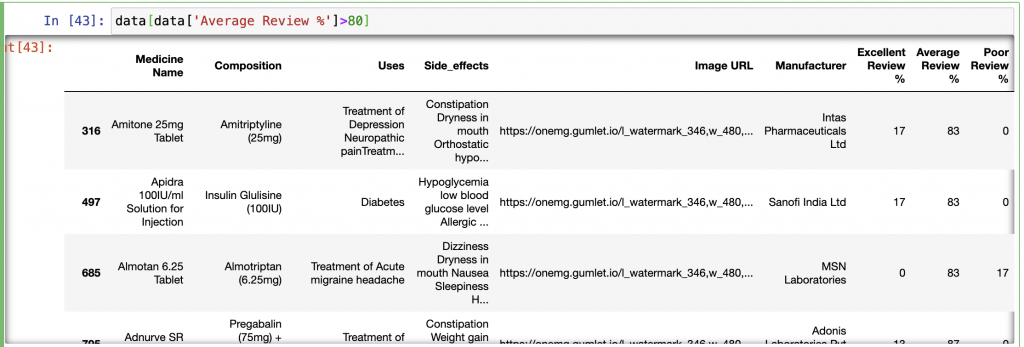
假設要找出 Poor Review % > 85 的藥品:
# 找出 Poor Review % > 85 的藥品
#→ 建立一個布林條件,篩選出「差評比例大於 85%」的藥品。

poor_reviewed_index = data[data['Poor Review %'] > 85].index

# 根據 index 把符合條件的藥品資料抓出來
#→ 把這些藥品的索引值(row index)抓出來存到 poor_reviewed_index。
poor_reviewed_pills = data.loc[poor_reviewed_index]

# 顯示結果
poor_reviewed_pills
輸出: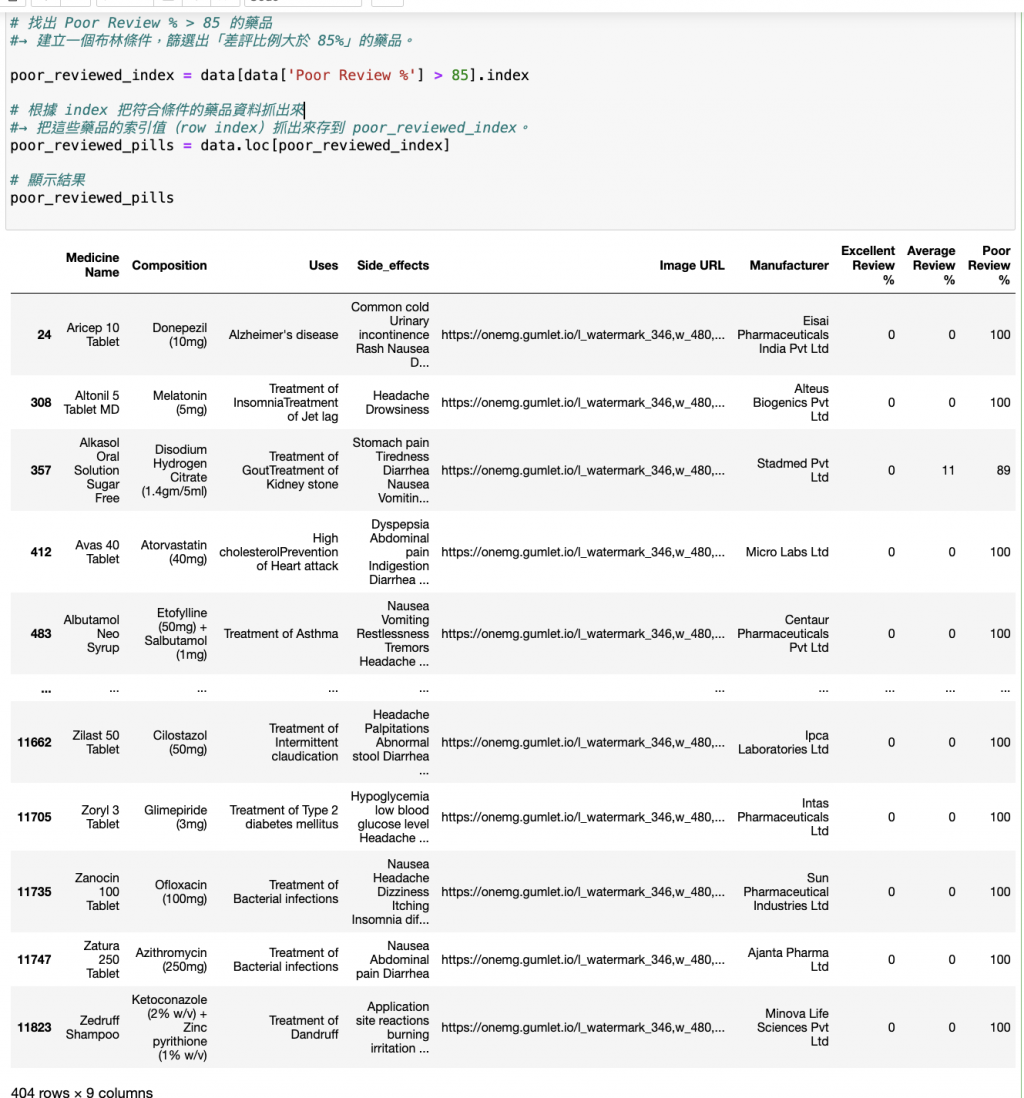
df.sort_values()對資料排序。(預設會是由小排到大,升序的概念)
data.sort_values(by='Excellent Review %')
輸出: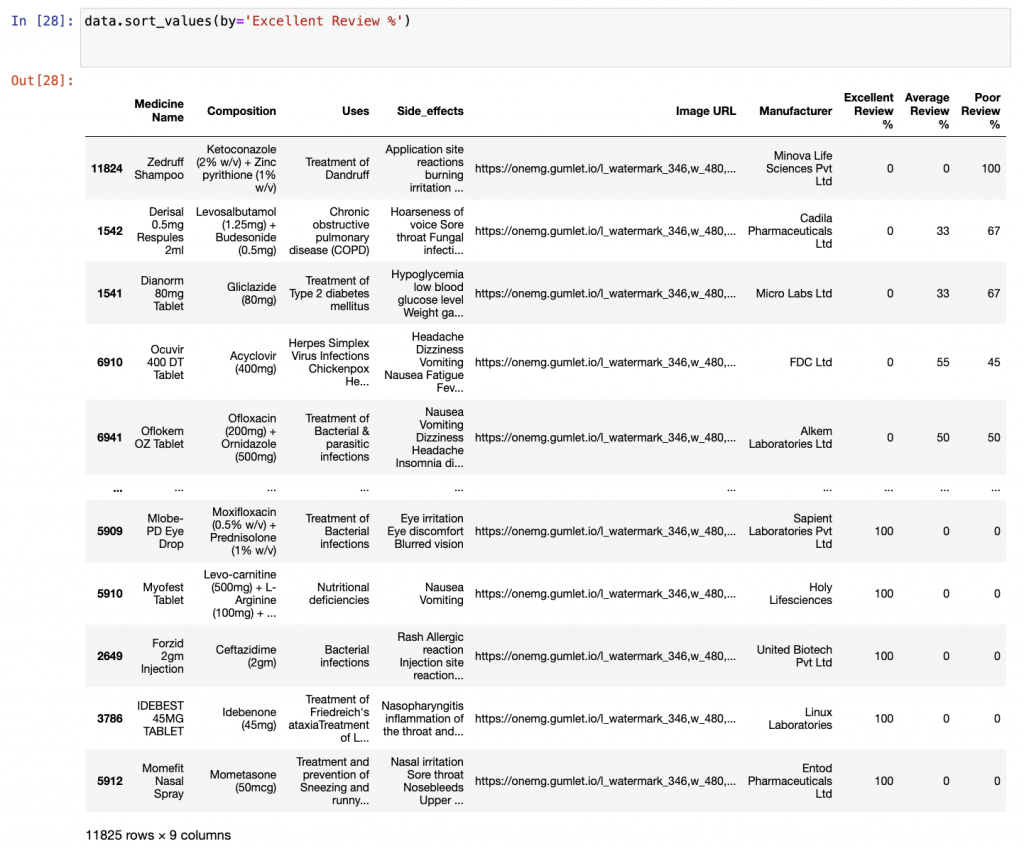
若要降序,也可以這樣指定(ascending=False):
data.sort_values(by='Average Review %', ascending=False)
輸出: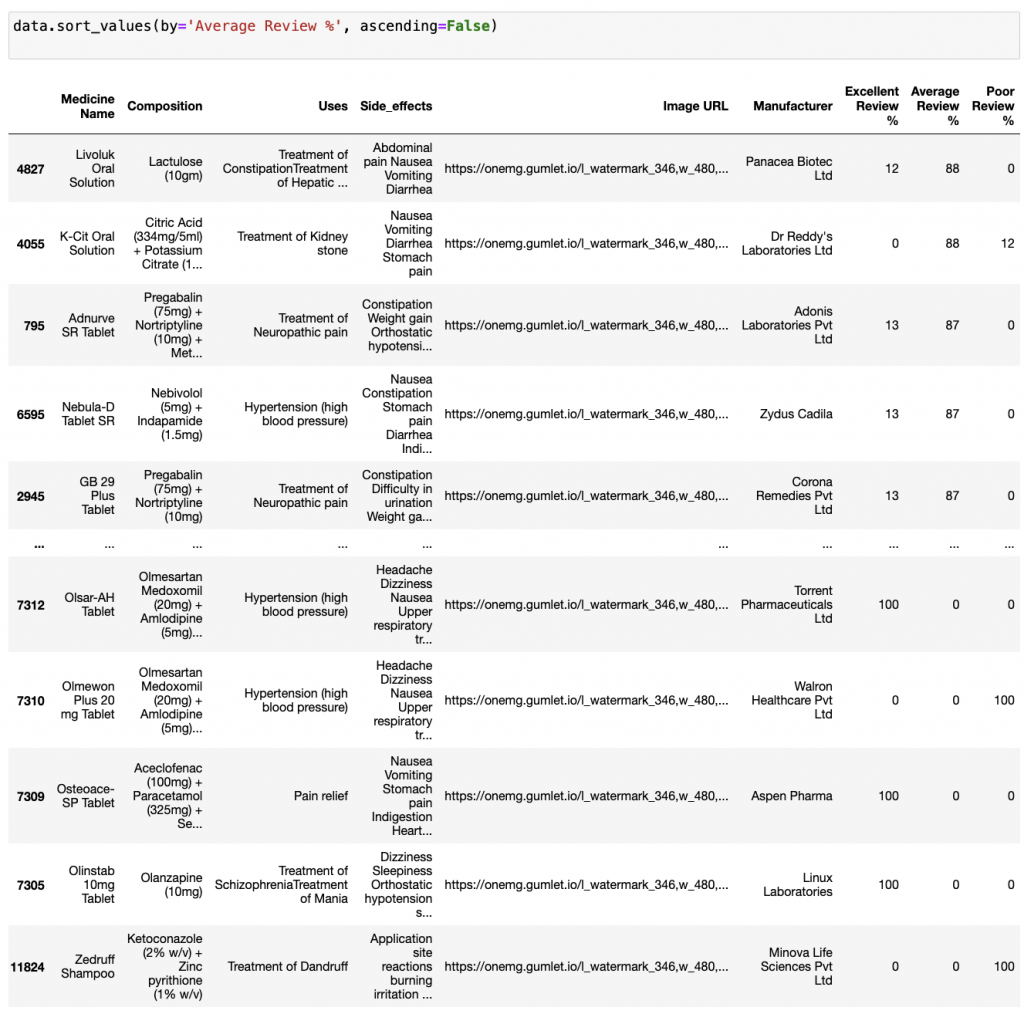
1.假設要找出前 10 名「Excellent Review %」最高的藥品並顯示藥品名稱和評價比例:
語法:利用 .nlargest()去找出前幾高的值
# Top 10 medicines with highest percentage of excellent reviews
top_excellent_reviews = data.nlargest(10, 'Excellent Review %')[['Medicine Name', 'Excellent Review %']]

top_excellent_reviews
這邊做了簡報詳細的解釋語法的運用: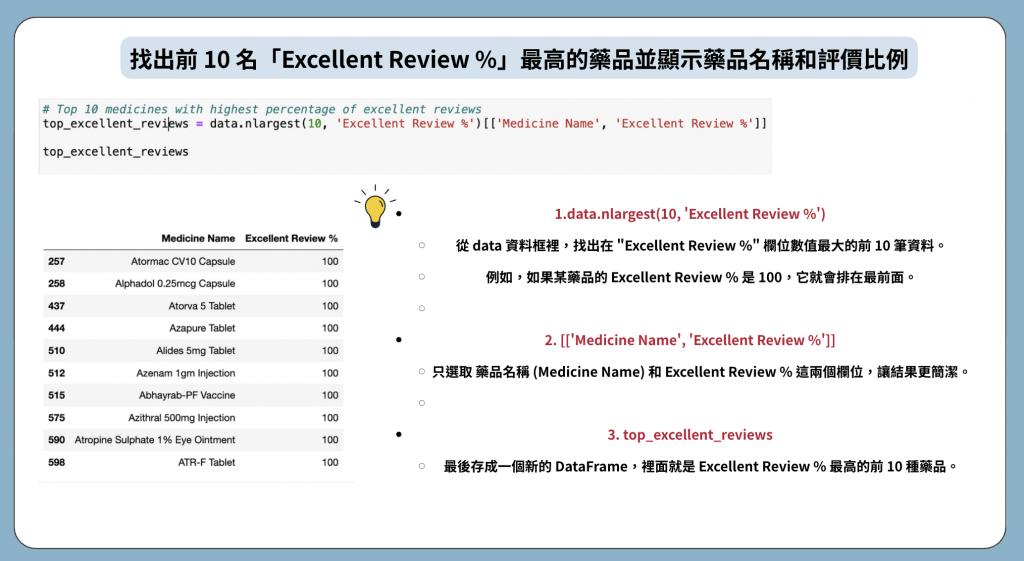
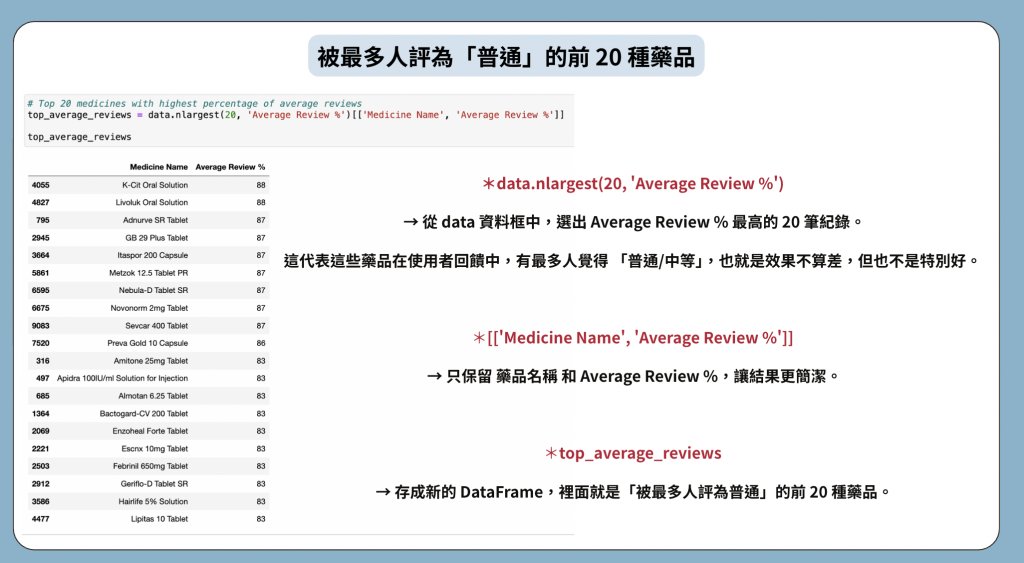
2.被最多人評為「普通」的前 20 種藥品:
語法:
# Top 20 medicines with highest percentage of average reviews
top_average_reviews = data.nlargest(20, 'Average Review %')[['Medicine Name', 'Average Review %']]

top_average_reviews
這邊要臨時插播一下一個語法(就是這麼突然):value_counts() 可以幫你快速統計某個欄位中,
每個值出現的次數,還會自動排序,超方便!!!
來看一些例子:
data['Uses'].value_counts()
輸出: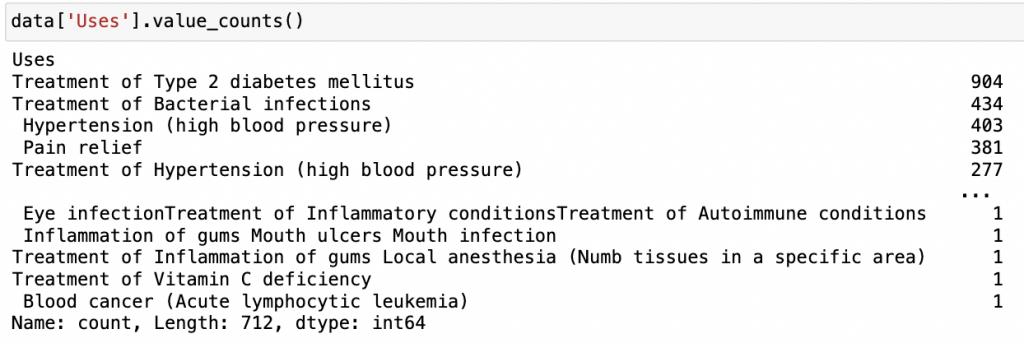
data['Manufacturer'].value_counts()
輸出: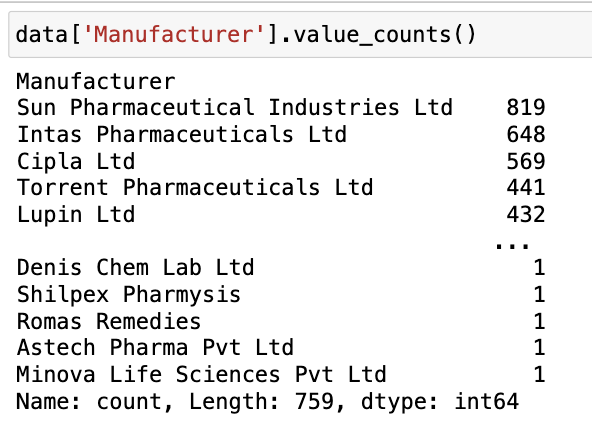
跟讀者說聲抱歉~今天這篇做的有一點趕!!
原先預計要介紹的內容可能會稍顯不完美~再請見諒!
今天我們主要完成了 CSV 匯入 → 基本資料檢視
→ 缺值/重複值檢查 → 排序與篩選 → 統計分析 的完整流程
明天是最後一天啦!!除了會分享一下完賽心得,
也會帶你進入 Pandas & Matplotlib 的可視化世界~
一行程式就能把數字變成圖表,讓資料「活起來」!!
這樣才叫做完美落幕!不然會有點遺憾~