
kube-prometheus-stack)今天的重點是佈署 Prometheus,從 Day15 佈署好的 OTel Collector Gateway 那裡獲取 demo-app 的監控數據。
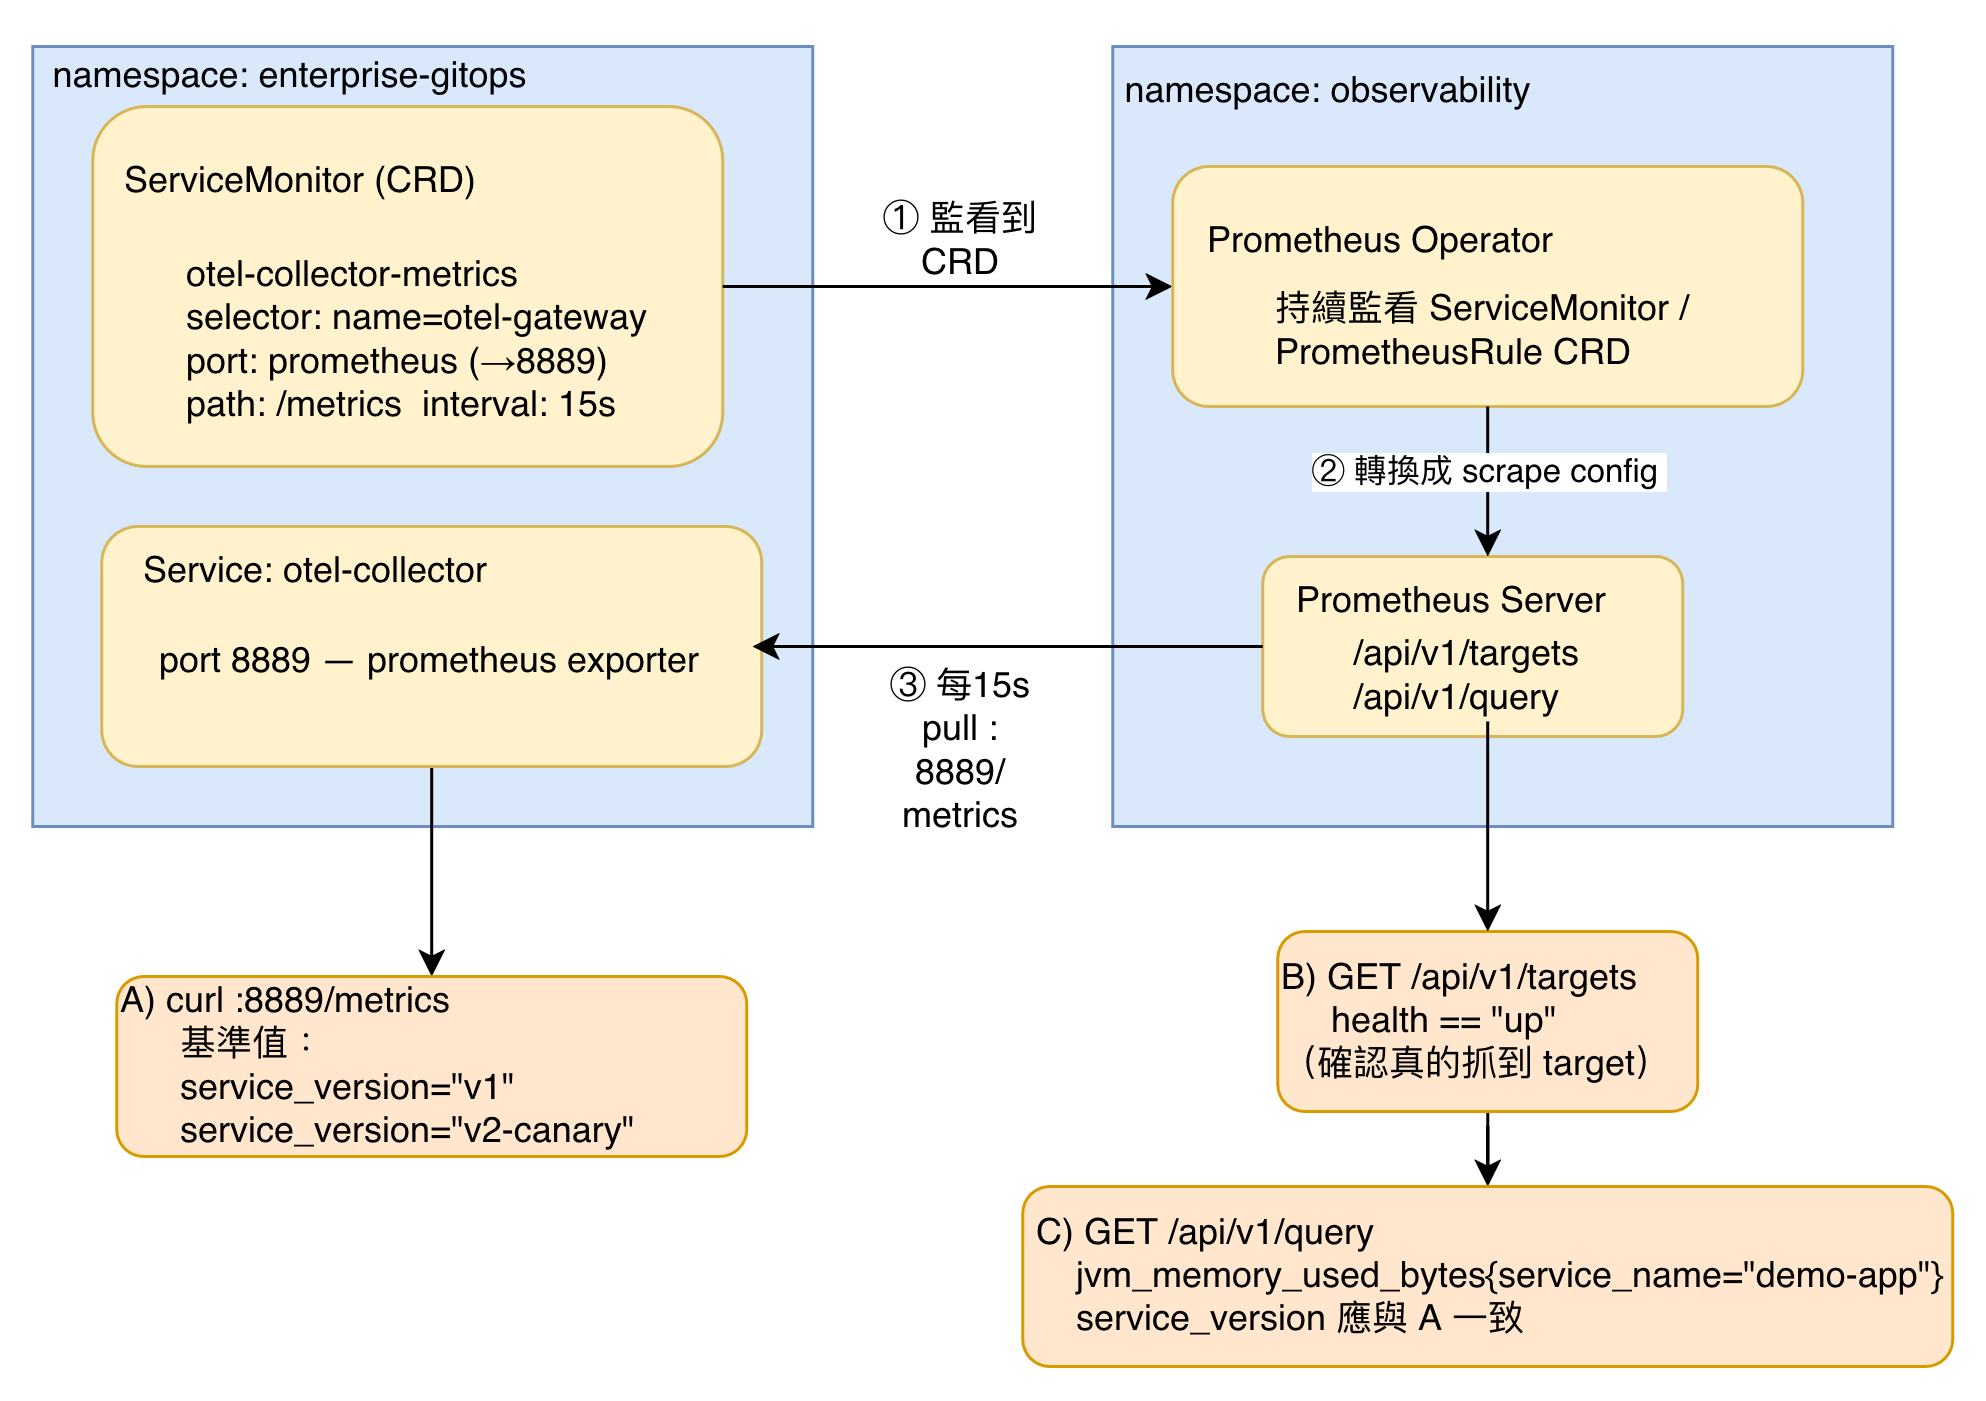
用的是 kube-prometheus-stack 這個 Helm chart,由 prometheus-community 維護,可以一次裝好一整套開箱即用的 Kubernetes 叢集監控方案,靠 Prometheus Operator 管理。打包在裡面的核心內容如下:
kube-prometheus-stack 負責把它裝上去,裝完之後它獨立運作。ServiceMonitor 和 PrometheusRule 這 2 種 CR,一偵測到變化,就自動轉換成 Prometheus 實際的 scrape config、alerting rule 或 recording rule。用到兩份檔案:
manifests/argocd-apps/prometheus-stack-app.yaml,讓 ArgoCD Application 佈署與管理。manifests/infrastructure/prometheus-stack/values.yaml,Helm chart 的 values.yaml。# prometheus-stack-app.yaml
apiVersion: argoproj.io/v1alpha1
kind: Application
metadata:
name: kube-prometheus-stack
namespace: argocd
spec:
project: <namespace>
sources:
- repoURL: 'https://prometheus-community.github.io/helm-charts'
chart: kube-prometheus-stack
targetRevision: "87.15.1"
helm:
valueFiles:
- $values/manifests/infrastructure/prometheus-stack/values.yaml
- repoURL: '<config repo 的 git clone URL,已省略帳號與 repo 名稱>'
targetRevision: main
ref: values
destination:
server: 'https://kubernetes.default.svc'
namespace: observability
syncPolicy:
automated:
prune: true
selfHeal: true
syncOptions:
- CreateNamespace=true
- ServerSideApply=true
sources:
kube-prometheus-stack chart 本體。讀取 Helm values 的方法是用 helm.valueFiles 的 $values/... 語法,指到第二個來源裡的 values.yaml。ref: values,當作「Helm values 的來源」。destination.namespace: observability:獨立於 demo-app/APISIX/OTel Collector 所在的 <namespace>,Prometheus/Grafana/Alertmanager 都會裝進這個新 namespace。syncOptions 裡的 ServerSideApply=true:kube-prometheus-stack 的 CRD(Prometheus、Alertmanager……)本體極大,預設的 client-side apply 會把整份 schema 塞進 kubectl.kubernetes.io/last-applied-configuration 這個 annotation,直接超過 K8s annotation 262144 bytes 的硬限制,導致 CRD 建立失敗。踩了坑之後,改用 Server-Side Apply,解決了問題。automated.prune: true/selfHeal: true:跟這個專案其他 Application 一樣的標準自動同步設定。Prometheus 要怎麼知道去哪裡抓監控數據,靠的是 ServiceMonitor 這個資源:
# otel-collector-servicemonitor.yaml
apiVersion: monitoring.coreos.com/v1
kind: ServiceMonitor
metadata:
  name: otel-collector-metrics
  namespace: <namespace>
spec:
  selector:
    matchLabels:
      app.kubernetes.io/name: otel-gateway
  endpoints:
    - port: prometheus
      path: /metrics
      interval: 15s
selector.matchLabels 靠 label 找到目標 Service otel-gateway,就是 Day15 建立的 Collector Gateway 的 Service。endpoints 指定要抓哪個具名 port:prometheus(對應目標 Service 的 exporter port 8889)、哪個路徑(/metrics)、多久抓一次(15s)。OTel Java Agent 產生的資料,會先進入 OTel Collector Agent,收攏到 Collector Gateway,最後被 Prometheus 收集起來。
我們在這裡要驗證 Collector Gateway 有沒有收攏到「能夠識別 Stable/Canary 各自的版本標籤」。
先回顧一下 Day06 讓 Stable/Canary 對外自稱同一個服務、只靠版本標籤區分的做法——兩份 Deployment 的環境變數:
# Stable(demo-app-v1.yaml)
env:
  - name: OTEL_SERVICE_NAME
    value: "demo-app"
  - name: OTEL_RESOURCE_ATTRIBUTES
    value: "service.version=v1,deployment.environment=production"

# Canary(demo-app-v2-canary.yaml)
env:
  - name: OTEL_SERVICE_NAME
    value: "demo-app"
  - name: OTEL_RESOURCE_ATTRIBUTES
    value: "service.version=v2-canary,deployment.environment=production"
兩邊 OTEL_SERVICE_NAME 是同一個值,OTEL_RESOURCE_ATTRIBUTES 裡的 service.version 才是唯一的差異。這兩個 OTel resource attribute,就是 「同一個服務、兩個可比較版本」 的根據。
我們直接訪問 Collector Gateway 自己的 Prometheus 端點,看看它有沒有收到 Stable / Canary 的標籤:
# 建立一個 K8s tunnel,會占用一個 terminal 視窗
kubectl port-forward -n <namespace> svc/otel-collector 18889:8889

# 用另一個 terminal 視窗輸入以下指令,篩出 demo-app 帶有 service_version 的那幾行
curl -s http://localhost:18889/metrics | grep 'service_name="demo-app"' | grep 'service_version'
在篩選出來的輸出裡,我們要找的是這兩個 OTel attribute 轉成 Prometheus labels 格式後的樣子:
service_name="demo-app"
service_version="v1" 與 service_version="v2-canary"
接下來我們與 Prometheus Server 建立一條 k8s tunnel,直接訪問它收到的 metric 裡面,有沒有來自 Collector Gateway 的資料,以及有沒有我們要的 Stable / Canary 的標籤。
# 建立一個 K8s tunnel,會占用一個 terminal 視窗
kubectl port-forward -n observability svc/prometheus-operated 19090:9090

# 用另一個 terminal 視窗輸入以下指令
curl -s "http://localhost:19090/api/v1/targets" \
  | jq -r '.data.activeTargets[] | select(.labels.job == "otel-collector") | .health'
jq:從回傳的 JSON 裡篩出 job 標籤等於 otel-collector 的那一個 target,只印出它的 health 欄位:
"up",代表整條鏈路(ServiceMonitor → Prometheus Operator → label selector 比對 → Prometheus 實際連線抓取)每一環都成功ServiceMonitor/label selector"up",代表 target 有被發現,但實際連線或抓取失敗。不過 "up" 只代表「有連上、有抓到東西」,不代表抓到的內容是對的。
透過 Prometheus 的查詢引擎 /api/v1/query 才拿得到真正的指標數值。這支 API 吃一段 PromQL,回傳 Prometheus 資料庫裡實際存的樣本值。查詢跟前面在 Gateway 端看到的同一個指標,確認 service_version 這個標籤有沒有原封不動地存進 Prometheus:
# 沿用同一條 tunnel(19090 已經接到 prometheus-operated:9090)

curl -s -G "http://localhost:19090/api/v1/query" \
  --data-urlencode 'query=jvm_memory_used_bytes{service_name="demo-app"}' \
  | jq -r '.data.result[].metric.service_version' | sort -u
curl -G --data-urlencode:/api/v1/query 這支 API 規定要把 PromQL 表達式放進一個叫 query 的參數裡(Prometheus 官方 HTTP API 規格定義的必要參數)。-G 讓 curl 把 --data-urlencode 的內容組成 GET 的 query string,並自動處理 {、" 這些特殊字元的 URL 編碼,不用自己手動轉義。query=jvm_memory_used_bytes{service_name="demo-app"}:這是送給 Prometheus 的 PromQL 表達式本體——jvm_memory_used_bytes 是要查的指標名稱,{service_name="demo-app"} 是 label matcher,鎖定 service_name 剛好等於 "demo-app" 的時間序列,避免 middle-app-b/middle-app-c(同樣有 jvm_memory_used_bytes、service_version="v1")混進來,讓查詢失真。回傳的 service_version 應該跟前面直接查 Gateway 時看到的一致——v1(或 Stable 當下實際版本)與 v2-canary 都要出現。如果這裡查到的版本標籤,跟 Gateway 端的原始內容對不上,代表 Prometheus 存進去的資料有失真(例如中間動過 relabeling 規則),問題不在 Collector,而在 Prometheus 這一層。
/api/v1/targets 的健康狀態);最後透過 Prometheus 自己的查詢引擎(/api/v1/query)確認它存進去的內容,跟源頭看到的基準一致。三層都通過,才算是從 Agent 到 Prometheus 查詢介面的整條鏈路端到端可信。/api/v1/targets 端點的 health/labels.job 欄位定義。/api/v1/query 端點如何吃一段 PromQL、回傳實際存在 Prometheus 裡的樣本值。jvm.memory.used 等 JVM 執行期指標的官方定義。. 換成 _,且指標名稱要補上單位後綴,是 jvm.memory.used → jvm_memory_used_bytes、service.version → service_version 這個轉換的依據。http.server.request.duration 的官方定義,是新舊指標命名對不上這個踩坑的判斷依據。resource_to_telemetry_conversion 與 target_info 的官方說明。sources 多來源語法、ref/$values 怎麼讓 Helm chart 引用另一個 git repo 裡的 values 檔案。


 iThome鐵人賽
 看影片追技術