
prometheus 插件,在閘道層收集監控數據Day15/16 拿到的,是 demo-app 這個應用程式自己講出來的健康狀況——JVM 記憶體用量、HTTP 請求延遲。今天要處理的是另一件事:如果流量根本沒有走到 demo-app,應用層的指標就完全不會有紀錄。
想像一個情境:APISIX 的限流插件把一波流量擋下來,或是某個 Canary Pod 掛了,APISIX 對外回 502 Bad Gateway——這兩種情況,請求都沒有走到 Spring Boot,demo-app 的 JVM/HTTP 指標完全不會有任何紀錄,因為代碼根本沒被執行到。
閘道層(Gateway)是最貼近使用者真實體感的第一道關卡,今天要做的,就是讓 APISIX 自己把這一段路發生的事講出來。
我們用 ApisixGlobalRule(全域規則),讓所有經過 APISIX 的流量都套用同一組設定:
ApisixRoute:只對明確寫出來的路由生效。新增一支 API 時,如果工程師忘記加上 prometheus 設定,這支 API 上線後在監控上就是隱形的——這是「監控盲區」的根源。ApisixGlobalRule:這裡的設定會無差別套用在所有經過閘道的流量上。真實設定放在 config repo 的 manifests/infra/apisix/global-rules/apisix-prometheus-global-rule.yaml:
# apisix-prometheus-global-rule.yaml
apiVersion: apisix.apache.org/v2
kind: ApisixGlobalRule
metadata:
  name: global-prometheus
  namespace: <namespace>
  labels:
    app.kubernetes.io/name: apisix
    app.kubernetes.io/component: observability
spec:
  ingressClassName: apisix
  plugins:
    - name: prometheus
      enable: true
spec.ingressClassName: apisix 是必填欄位,controller 靠它判斷「這個資源該不該由我認領」——沒填的話,K8s 物件不會報錯、ArgoCD 一樣顯示 Synced/Healthy,但 controller 會靜默忽略它,這條規則實際上不會生效。
spec.plugins 啟用 prometheus plugin,啟用後 APISIX 會開始收集以下這些閘道層的監控數據:
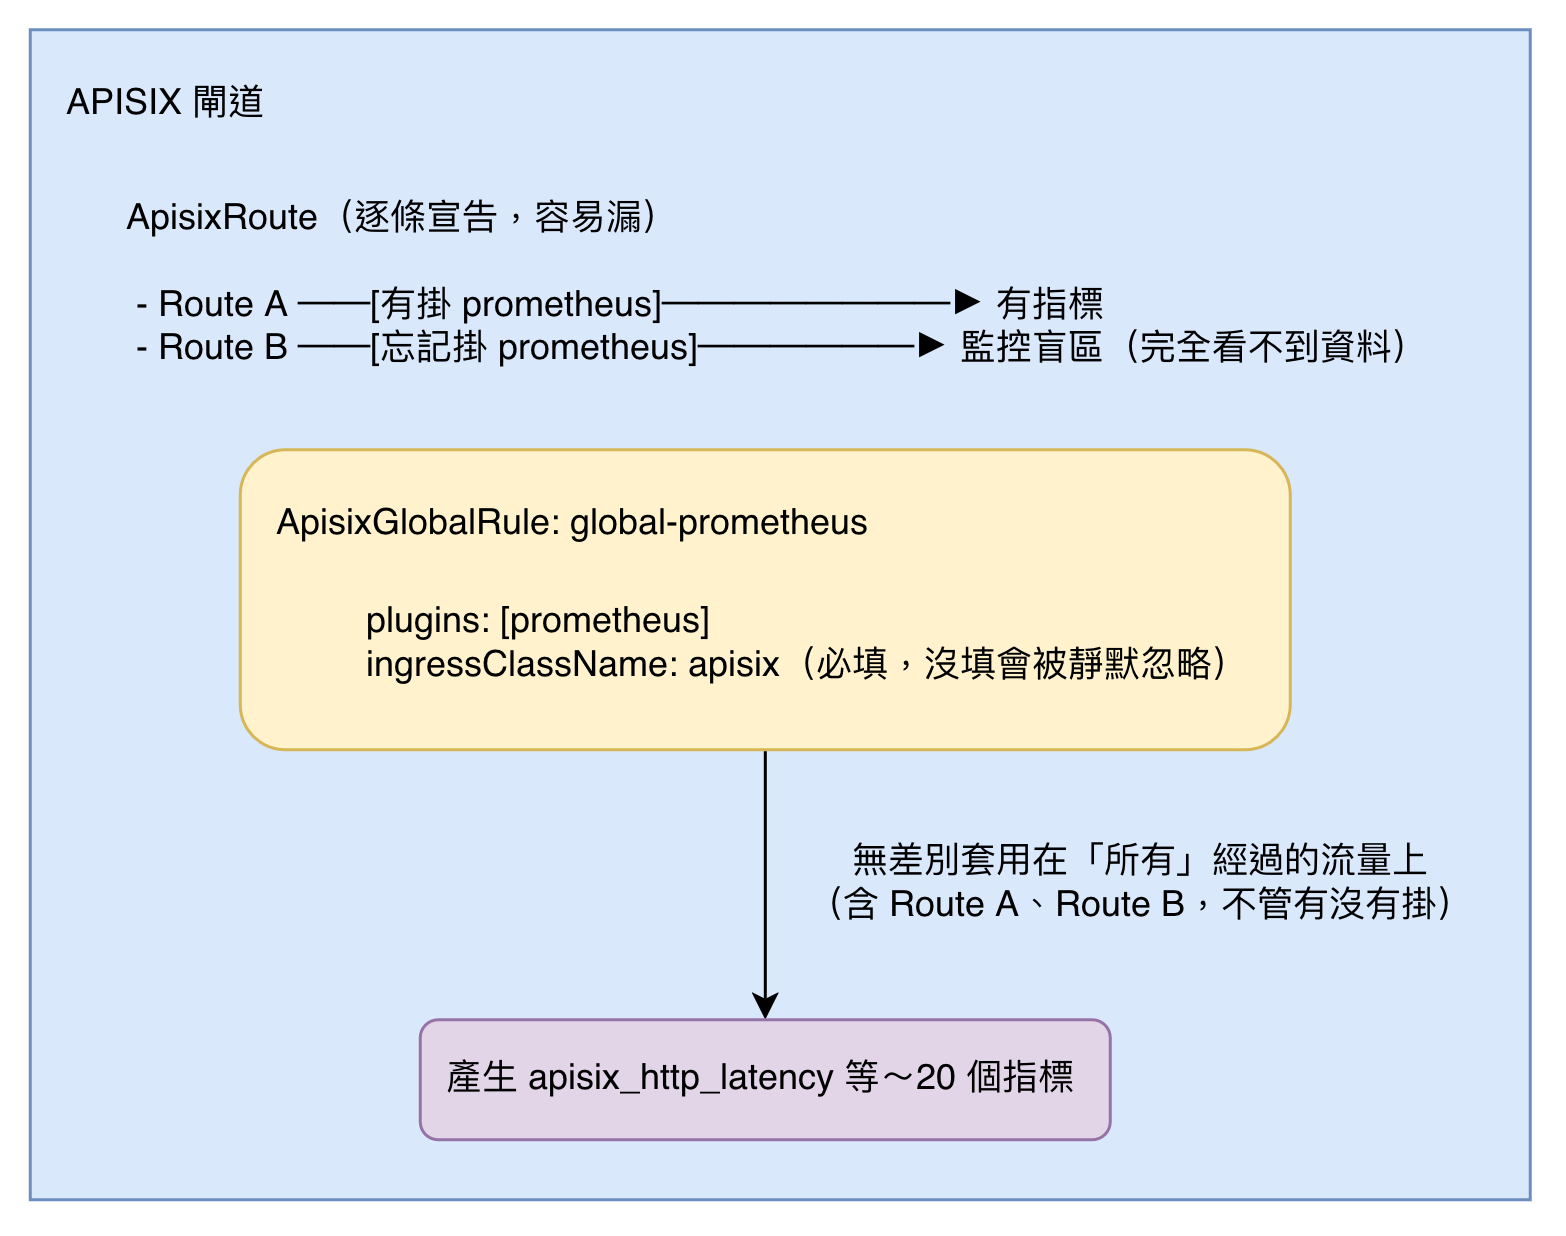
插件啟用後,APISIX 一次會暴露將近 20 個指標,我們接下來會用到的是:
apisix_http_latency:P50/P95/P99 延遲分佈(Day22 建的 APISIX Upstream Health 面板會用到)沒有辦法只讓插件收集這一個、關掉其他的——插件本身沒有提供選擇性開關,一啟用就是全部一起收。我們會在 Prometheus Server 那端的設定裡指定只收這個監控數據,避免儲存不必要的數據。
# apisix-servicemonitor.yaml
apiVersion: monitoring.coreos.com/v1
kind: ServiceMonitor
metadata:
  name: apisix-metrics
  namespace: <namespace>
  labels:
    app.kubernetes.io/name: apisix
    app.kubernetes.io/component: observability
spec:
  selector:
    matchLabels:
      app.kubernetes.io/name: apisix
      app.kubernetes.io/instance: apisix-gateway
  endpoints:
    - port: prometheus
      path: /apisix/prometheus/metrics
      interval: 15s
      metricRelabelings:
        - sourceLabels: [__name__]
          regex: 'apisix_http_latency_bucket|apisix_http_latency_sum|apisix_http_latency_count'
          action: keep
selector.matchLabels 裡的 app.kubernetes.io/instance: apisix-gateway:Helm 部署 APISIX 時沒有另外指定 release 名稱,就會直接用 ArgoCD Application 自己的名字(apisix-gateway)當作這個標籤的值——要跟實際 Service 上的標籤對得上,Prometheus 才抓得到。endpoints:
prometheus,實際對應 9091
/apisix/prometheus/metrics
15s 抓一次metricRelabelings:APISIX prometheus plugin 會暴露將近 20 個指標。這個欄位可以 指定存儲的指標,作用時機是「樣本已經抓回來,但還沒寫進資料庫之前」
sourceLabels: [__name__] 指的是指標名稱本身regex 列出要留下的名字。apisix_http_latency 指標實際會展開成 _bucket/_sum/_count 三個獨立指標,所以規則要涵蓋這三個。action: keep 表示只留下匹配到的,其餘一律丟棄,不會進到 Prometheus 的 TSDB 裡佔空間。# apisix-global-rules-app.yaml
apiVersion: argoproj.io/v1alpha1
kind: Application
metadata:
name: apisix-global-rules
namespace: argocd
spec:
project: <namespace>
source:
repoURL: '<config repo 的 git clone URL,已省略帳號與 repo 名稱>'
path: manifests/infra/apisix/global-rules
targetRevision: main
destination:
server: 'https://kubernetes.default.svc'
namespace: <namespace>
syncPolicy:
automated:
prune: true
selfHeal: true
syncOptions:
- CreateNamespace=true
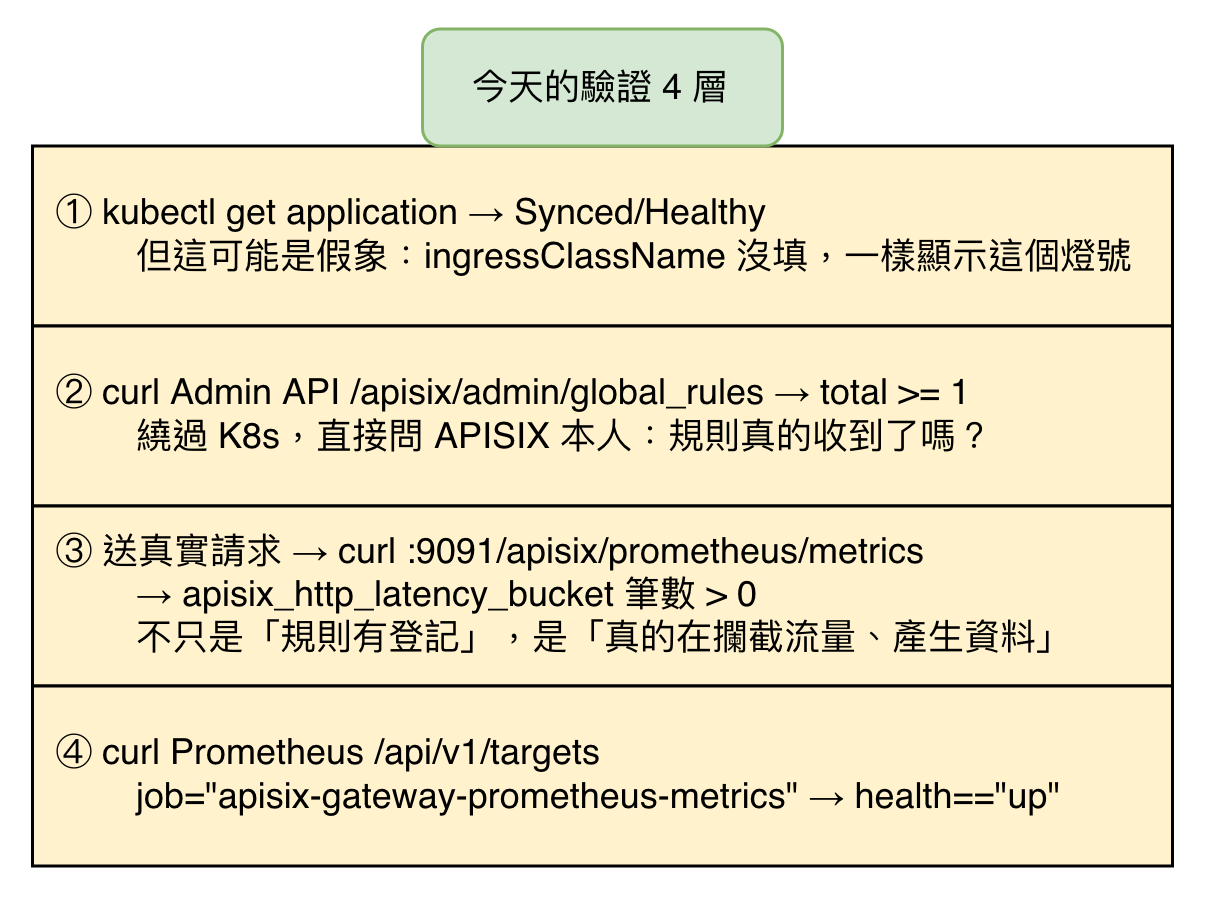
ApisixGlobalRule 部署好、ArgoCD 顯示 Synced/Healthy,不代表它真的生效——上面提過,ingressClassName 沒填的話,K8s 物件本身完全正常,但 controller 根本不會把它同步進 Admin API。真正的驗證,得繞過 K8s 物件本身,一路查到 APISIX 跟 Prometheus。
kubectl get application apisix-global-rules -n argocd \
  -o jsonpath='{.status.sync.status}/{.status.health.status}'
要印出 Synced/Healthy。但這只是最外層、最基本的檢查——GitOps 部署這個動作本身有沒有成功,不代表後面任何一段真的通。
ApisixGlobalRule 有沒有真的同步進 Admin API# 建立一個 K8s tunnel,會占用一個 terminal 視窗
kubectl port-forward -n <namespace> svc/apisix-gateway-admin 19180:9180
# 用另一個 terminal 視窗輸入以下指令
curl -s -H "X-API-KEY: <替換成叢集裡實際的 Admin API Token>" \
"http://localhost:19180/apisix/admin/global_rules" \
| jq -r '.total // 0'
X-API-KEY 是 APISIX Admin API 的認證方式,要換成叢集裡實際設定的 token。回傳的 total 要 >= 1,才代表 controller 真的把這條規則同步進 APISIX 自己的設定裡——這一步專門用來戳破「ArgoCD 綠燈」這個假象,繞過 K8s,直接問 APISIX 本人。
# 先送幾次真實請求,讓 APISIX 有東西可以記錄
curl -s -o /dev/null -H "Host: demo-app.example.com" "http://<APISIX 對外 IP>/api/hello"

# 建立一個 K8s tunnel,會占用一個 terminal 視窗
kubectl port-forward -n <namespace> svc/apisix-gateway-prometheus-metrics 19091:9091

# 用另一個 terminal 視窗輸入以下指令
curl -s "http://localhost:19091/apisix/prometheus/metrics" \
  | grep -c '^apisix_http_latency_bucket{'
grep -c 數的是有幾行 apisix_http_latency_bucket{...} 開頭的輸出,要大於 0——這一步驗證的不只是「規則有登記」,是「規則真的在攔截流量、產生資料」。
# 建立一個 K8s tunnel,會占用一個 terminal 視窗
kubectl port-forward -n observability svc/prometheus-operated 19095:9090

# 用另一個 terminal 視窗輸入以下指令
curl -s "http://localhost:19095/api/v1/targets" \
  | jq -r '.data.activeTargets[] | select(.labels.job == "apisix-gateway-prometheus-metrics") | .health'
job 標籤要填 apisix-gateway-prometheus-metrics(被 scrape 的 Service 名稱,不是 ServiceMonitor 自己的名稱 apisix-metrics),health 要是 up——這一步跟 Day16 驗證 OTel Collector 時用的是同一招,這次目標換成 APISIX 的端點。
4 項全部通過,才代表從「Global Rule 生效」到「Prometheus 查詢介面查得到」這條鏈路,是端到端真的可信。以上 4 步已經包成一支腳本,可以一次跑完,不用一段一段手動執行:
chmod +x scripts/verify-day17-apisix-metrics.sh
./scripts/verify-day17-apisix-metrics.sh
apisix_http_latency 是閘道層的視角,不是拿來做 Stable/Canary 對比的依據——Day21、22 會發現 APISIX 因為架構限制,沒辦法在這個指標上區分請求最終是被 Stable 還是 Canary 處理,那個對比最終還是要靠應用層(service_version 標籤)的指標。prometheus 插件預設的 metrics 端點路徑與 port。spec.ingressClassName 的用途。ServiceMonitor.spec.endpoints[].metricRelabelings 欄位的官方定義,樣本寫入前的過濾機制。/api/v1/targets 端點的 health/labels.job 欄位定義。


 iThome鐵人賽
 看影片追技術