
今天我們把 Prometheus、Tempo、Loki 三個工具接進 Grafana 成為 Datasource。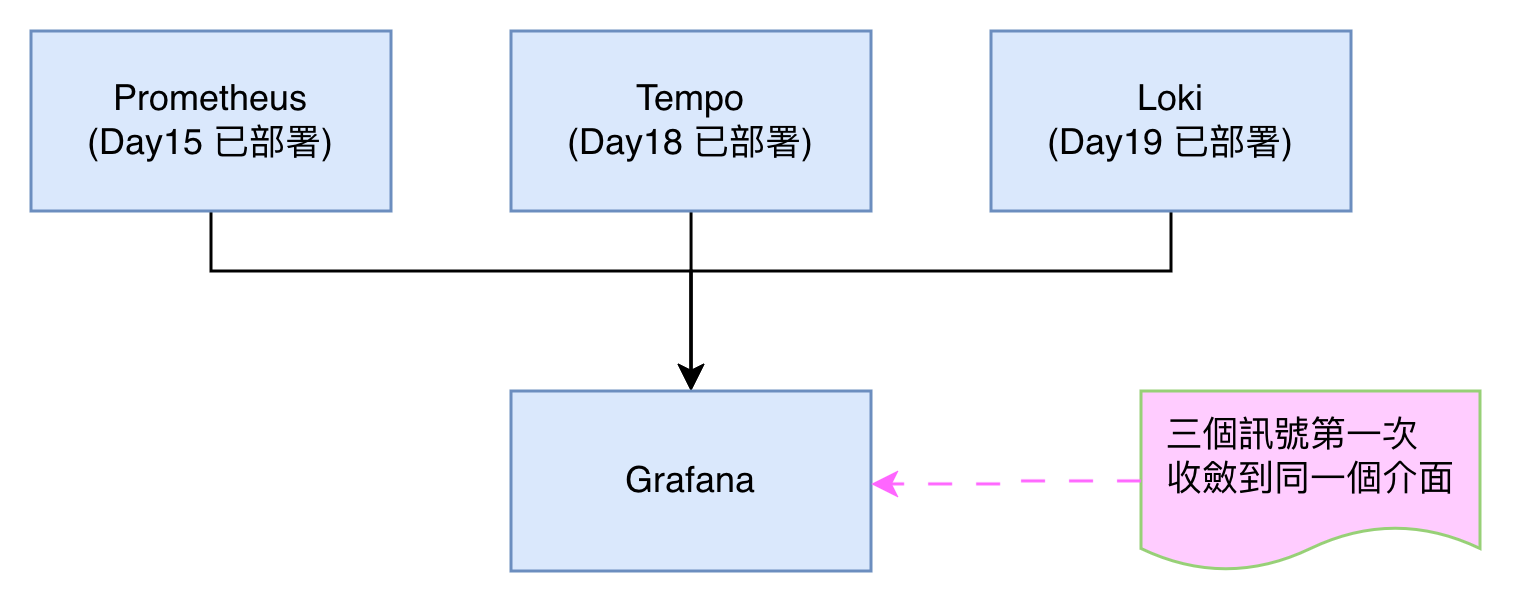
Helm kube-prometheus-stack 是一個「大禮包」Chart,同時打包了 Prometheus、Alertmanager,還有 Grafana。grafana.enabled: true 會讓 Grafana 的 Deployment、Service、ConfigMap 等資源,跟著 Prometheus、Alertmanager 一起,用 同一個 Helm Release 渲染出來:
# manifests/infrastructure/prometheus-stack/values.yaml
grafana:
  enabled: true
  sidecar:
    dashboards:
      enabled: true
      label: grafana_dashboard
      labelValue: "1"
分成 "自動" 和 "手動"。
因為 Prometheus 跟 Grafana 是同一個 Helm chart(同一個 Release)裝出來的,chart 自己的 template 就能直接生成一個指向「自己裝的 Prometheus」的 Datasource,不用另外設定。
Tempo 跟 Loki 不屬於 kube-prometheus-stack 管理的範圍,需手動接入:
# manifests/infrastructure/prometheus-stack/values.yaml
grafana:
  additionalDataSources:
    - name: Tempo
      type: tempo
      access: proxy
      url: http://tempo.<namespace>.svc.cluster.local:3200
    - name: Loki
      type: loki
      access: proxy
      url: http://loki.observability.svc.cluster.local:3100
Tempo 和 Loki 的 URL:
<Service 名稱>.<namespace>.svc.cluster.local:<port>
驗證策略:
kube-prometheus-stack 這個 ArgoCD Application Synced/Healthy# 取得 Grafana admin 密碼
kubectl get secret kube-prometheus-stack-grafana -n observability \
-o jsonpath='{.data.admin-password}' | base64 -d
# port-forward 到 Grafana
kubectl port-forward svc/kube-prometheus-stack-grafana -n observability 3000:80
http://localhost:3000。登入 Grafana。condition 欄位讓父 Chart 有條件啟用子 Chart 依賴的官方機制說明,grafana.enabled 背後就是這個機制。


 iThome鐵人賽
 看影片追技術