提醒: 本篇文章的code在這裡: Titanic
新增資料有兩種可能的意思: 要新增column或是要新增row,在pandas可透過concat完成這件事。順帶一提,concat是concatenate的縮寫,其實是把兩張DataFrame併在一起的意思,不過這邊純粹是整併同樣順序或是同樣欄位的DataFrame,如果你希望透過某個欄位的值對應出其他欄位,那麼你需要尋找的語法叫做join,由於這屬於相對進階的操作,並不會在這一系列的文章中提及。
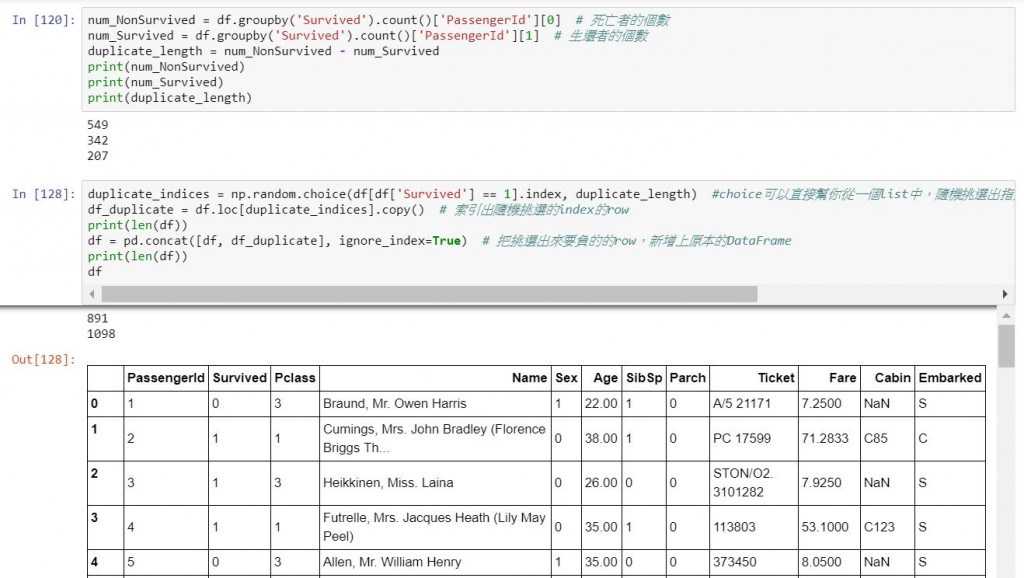
這邊用一個案例,假設你發現要拿來預測的資料的類別比例與訓練資料的比例不符,(你可以透過上傳全部為1的檔案去看分數判斷每個類別的比例(噓...我什麼都沒說)),在鐵達尼號來說可能你發現生還者的比例在測試資料比較高。那麼你可能要複製一些生還者的資料,已使預測結果的比例比較接近測試資料,增加比賽準確度。
num_NonSurvived = df.groupby('Survived').count()['PassengerId'][0]  # 死亡者的個數
num_Survived = df.groupby('Survived').count()['PassengerId'][1]  # 生還者的個數
duplicate_length = num_NonSurvived - num_Survived
print(num_NonSurvived)
print(num_Survived)
print(duplicate_length)
duplicate_indices = np.random.choice(df[df['Survived'] == 1].index, duplicate_length)  #choice可以直接幫你從一個list中,隨機挑選出指定size的item。這便則可以挑選出,特定size的index值。
df_duplicate = df.loc[duplicate_indices].copy()  # 索引出隨機挑選的index的row
print(len(df))
df = pd.concat([df, df_duplicate], ignore_index=True)  # 把挑選出來要負的的row,新增上原本的DataFrame
print(len(df))
df
這裡當然也可以用concat去做(設定axis=1),不過一般你要做出一個與DataFrame等長的、而且直接對應到rowID的資料欄位,除了跑回圈取得之外,也很難用其他方法做出來,所以這邊就來介紹一下,DataFrame跑回圈的幾種方法。
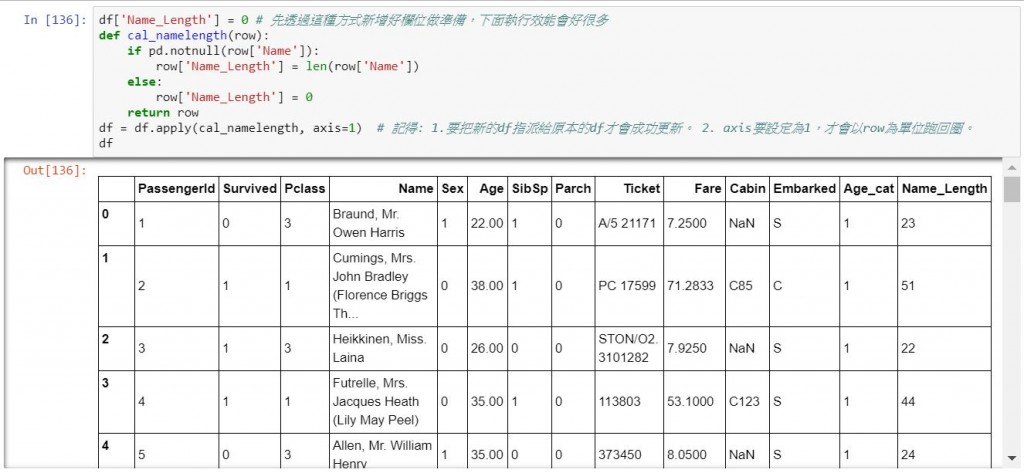
df['Name_Length'] = 0 # 先透過這種方式新增好欄位做準備,下面執行效能會好很多
def cal_namelength(row):
    if pd.notnull(row['Name']):
        row['Name_Length'] = len(row['Name'])
    else:
        row['Name_Length'] = 0
    return row
df = df.apply(cal_namelength, axis=1)  # 記得: 1.要把新的df指派給原本的df才會成功更新。 2. axis要設定為1,才會以row為單位跑回圈。
# 順帶一提,其實Series也可以直接使用applyfunction,詳情見本篇文章最後一部分。
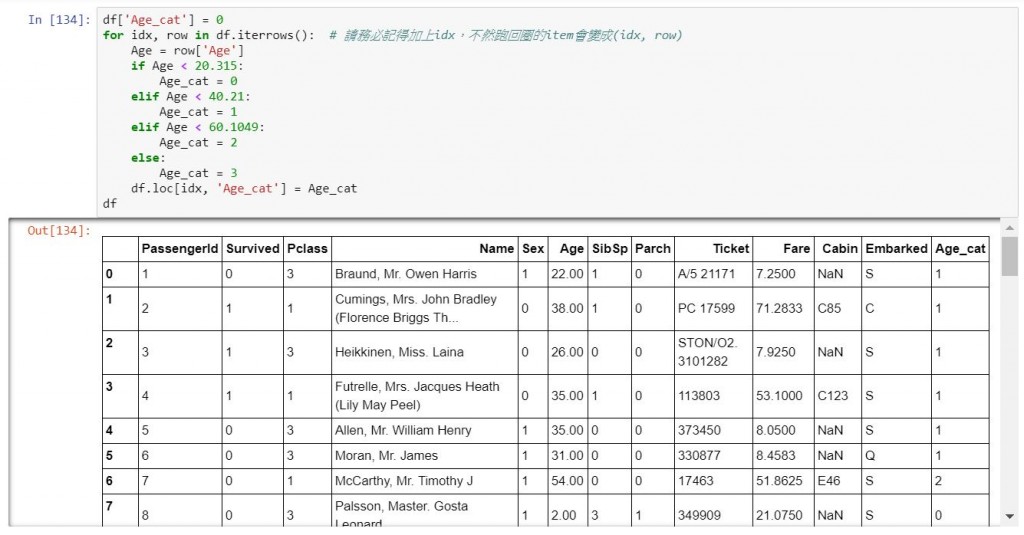
df['Age_cat'] = 0
for idx, row in df.iterrows():  # 請務必記得加上idx,不然跑回圈的item會變成(idx, row)
    Age = row['Age']
    if Age < 20.315:
        Age_cat = 0
    elif Age < 40.21:
        Age_cat = 1
    elif Age < 60.1049:
        Age_cat = 2
    else:
        Age_cat = 3
    df.loc[idx, 'Age_cat'] = Age_cat
df
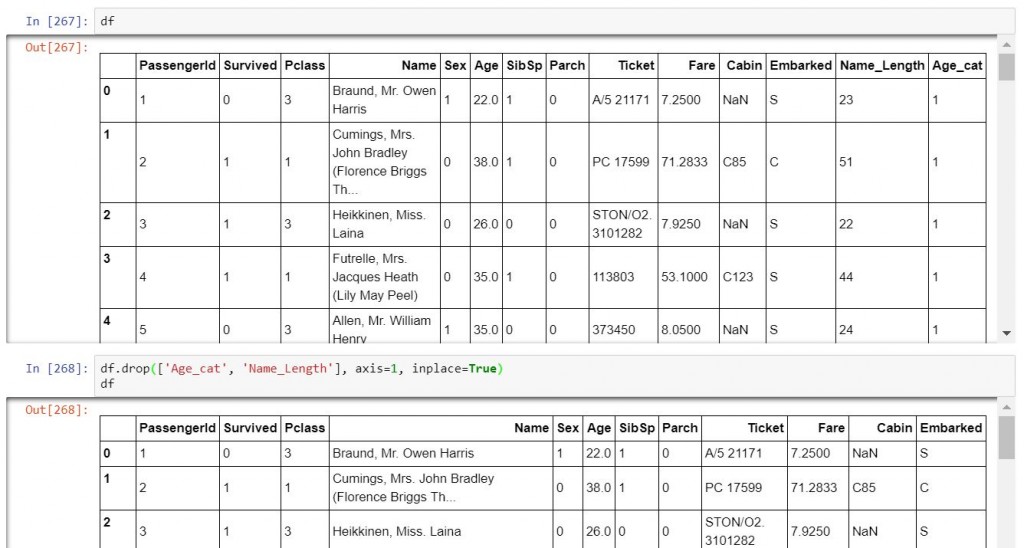
刪除資料一樣可以分為丟掉column或是row。
df.drop(['Age_cat', 'Name_Length'], axis=1, inplace=True) #把['Age_cat', 'Name_Length']丟掉,記得axis=1代表丟的是columns。inplace則是代表把更新後的df指派給原本的df。
df
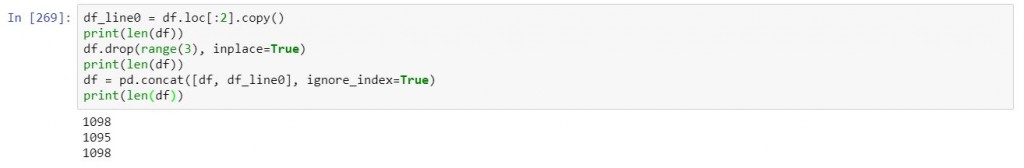
df_line0 = df.loc[:2].copy()
print(len(df))
df.drop(range(3), inplace=True)
print(len(df))
df = pd.concat([df, df_line0], ignore_index=True)
print(len(df))
df.groupby('Age_cat').count() #每一個類別的次數
df.groupby('Age_cat').mean() #每一個類別個項目的平均
df.groupby('Age_cat').median() #每一個類別個別項目的中位數
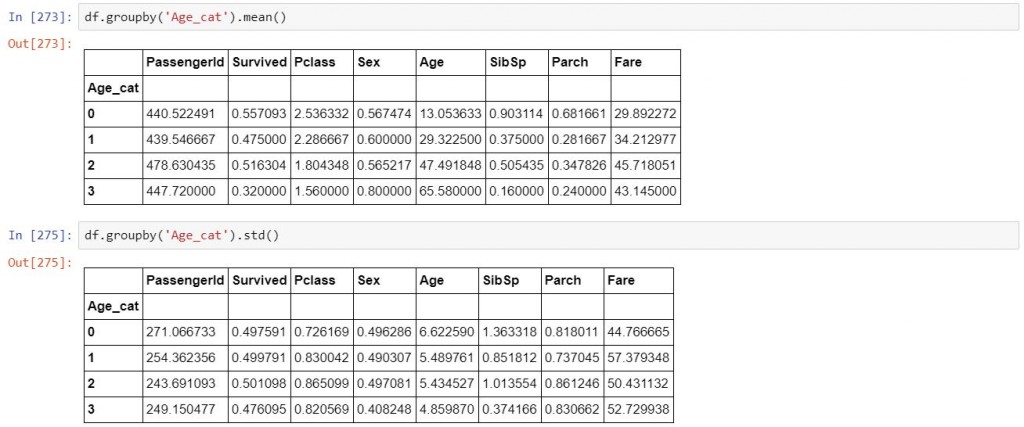
df.groupby('Age_cat').std() #每一個類別個別項目的標準差
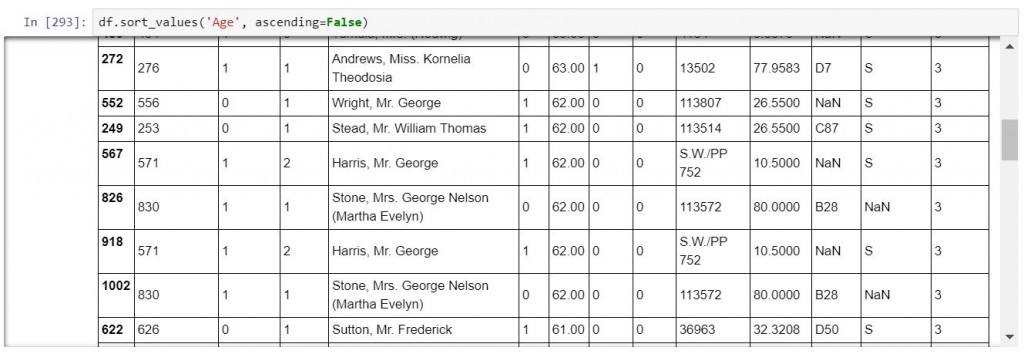
df.sort_values('Age', ascending=False)
pandas的教程就到這邊告一段落拉。我知道,學這些基本工具很痛苦,不過這大約也是我覺得最重要的基礎技能。所以為了讓大家有繼續看下去的動力,這邊來給大家一個好玩的小專案,大家可以自己玩玩。不過因為使用到一些自然語言處理的技術,後面的文章會詳細的談,大家先玩玩就好。總之,我們可以來看一下,哪一些詞彙在人名當中出現比較多次。
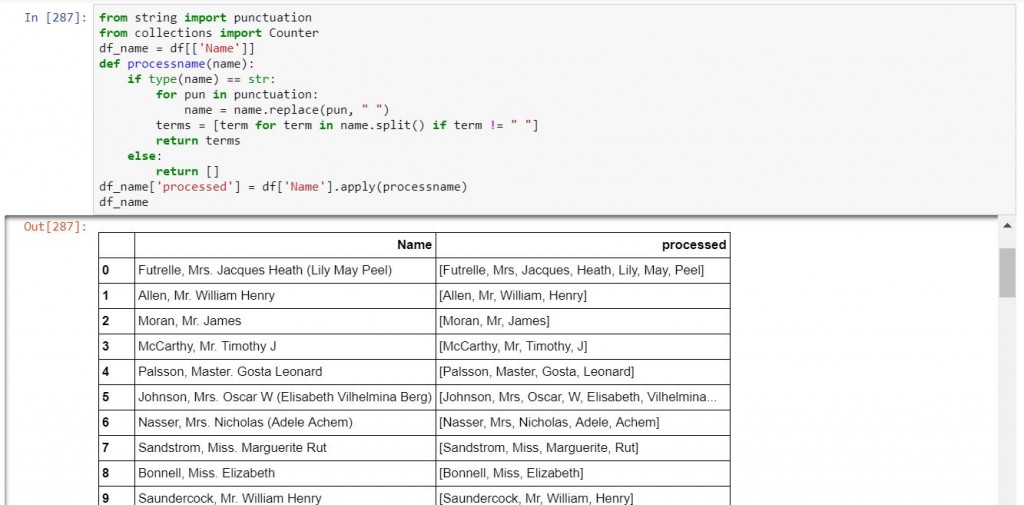
from string import punctuation
from collections import Counter
df_name = df[['Name']]
def processname(name):
    if type(name) == str:
        for pun in punctuation:
            name = name.replace(pun, " ")
        terms = [term for term in name.split() if term != " "]
        return terms
    else:
        return []
df_name['processed'] = df['Name'].apply(processname)
df_name
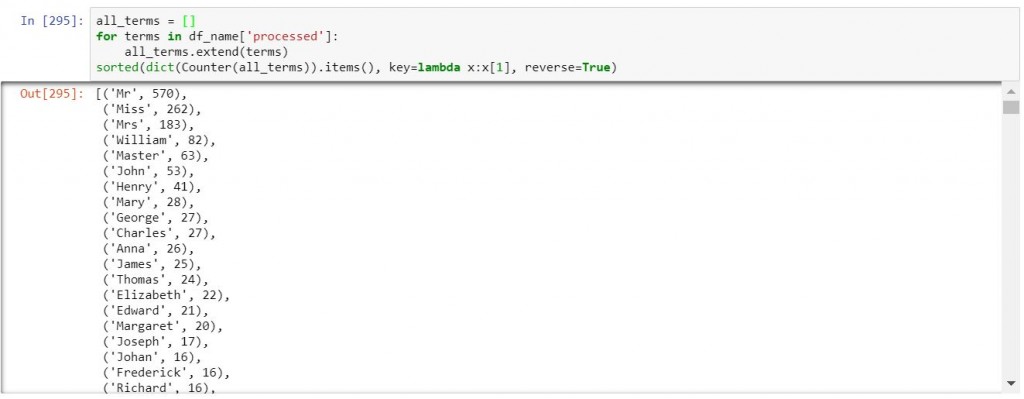
all_terms = []
for terms in df_name['processed']:
    all_terms.extend(terms)
sorted(dict(Counter(all_terms)).items(), key=lambda x:x[1], reverse=True)
3.畫出漂亮的文字雲
import matplotlib.pyplot as plt
from wordcloud import WordCloud

wordcloud = WordCloud()
wordcloud.generate_from_frequencies(frequencies=dict(Counter(all_terms)))
plt.figure()
plt.imshow(wordcloud, interpolation="bilinear")
plt.axis("off")
plt.show()


 iThome鐵人賽