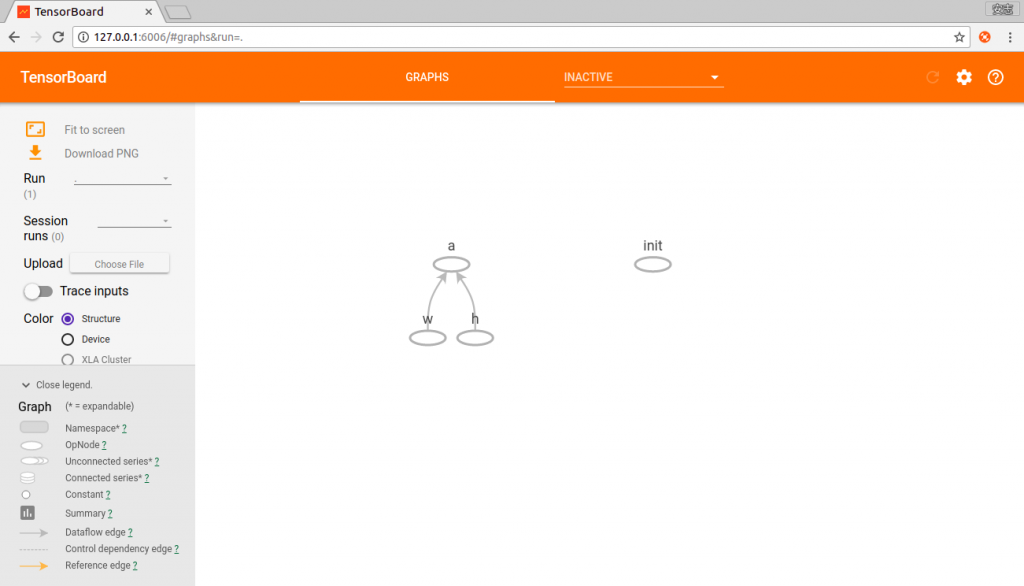
今天我們來介紹一個tensorflow提供的一個可以讓你以視覺化的方式,查看『計算圖』的方法。
import tensorflow as tf
width = tf.placeholder("int32" ,name="w")
height = tf.placeholder("int32",name-"h")
area=tf.multiply(width,height ,name="a")
sess = tf.Session()
init = tf.global_variables_initializer()
sess.run(init)
print ('area=' ,sess.run(area,feed_dict={width :8 ,height: 8}))
sess.close()
tf.summary.merge_all()
train_writer=tf.summary.FileWriter('log/area',sess.graph)
(1)設定name使圖看起來更易懂
(2)tf.summary.merge_all() 將所有要顯示再tensorboard的資料整合
(3)train_writer=tf.summary.FileWriter('log/area',sess.graph) 將整合好的資料寫入log檔。 位置為當前執行目錄底下的log/area資料夾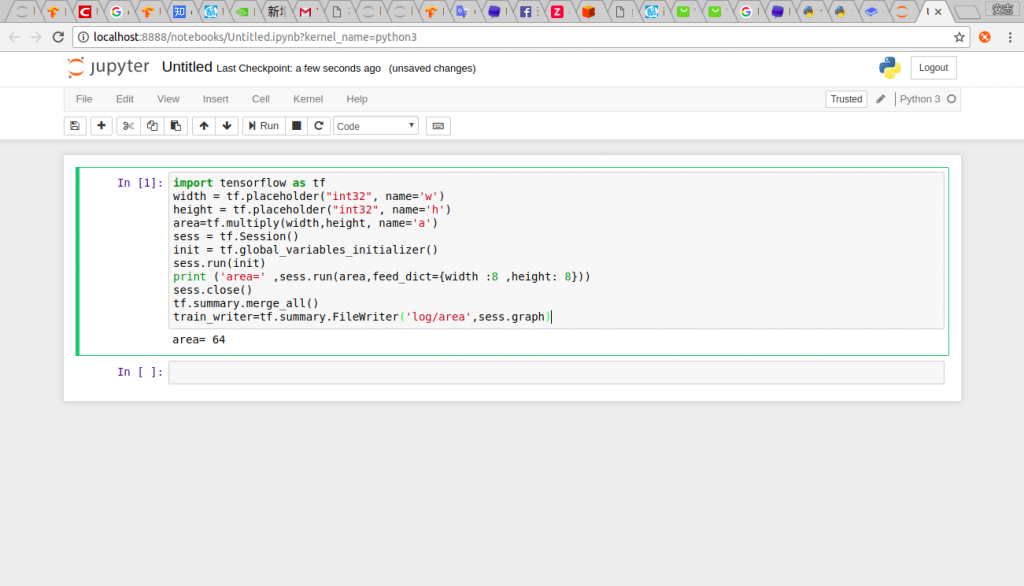
$ tensorboard --logdir=~/test1/log/area
再終端機執行以上指令,logdir後面接你存放log檔的位置,不能照抄。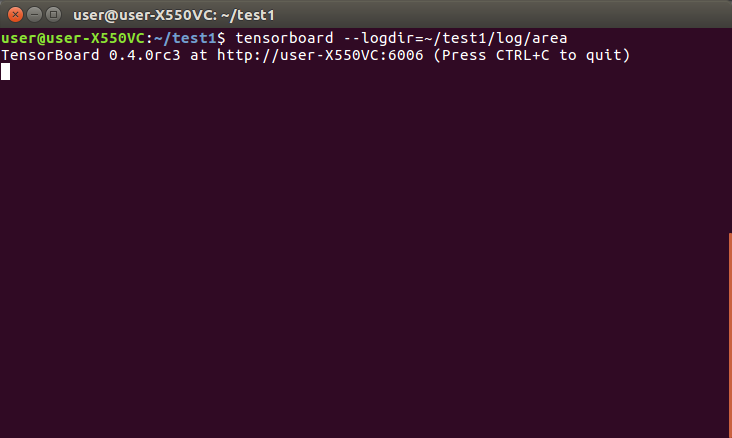
到了這邊就可以直接使用瀏覽器url輸入127.0.0.1:6006即可看到tensorboard的結果