
在蒐集資料的過程中,可能會因測量方法、人為疏失或實驗誤差等,導致所蒐集到的資料中出現個別值極度異於其它資料的值,即為離群值(Outlier);離群值可能導致分析結果難以解釋,因此需要找出這些離群值,再與具有專業領域知識的人討論造成這些離群值的原因,個別做相對應的處理,以利後續進行統計分析進行。
When collecting data, we might end up getting some outliers - the value that are really different from rest of the value, causing by the measuring method we use, human error or sometimes some experimental error. Outliers could be hard to explain in the analysis results, thus, we need to find out these outliers and cooperate with people with field knowledge, in order to figure out what is the cause of every single outlier and deal with them using proper methods.
可以針對資料繪圖(如直方圖、盒圖、分布圖等),或透過檢查數值範圍(五值、平均數及標準差等) 來找出離群值,並要盡可能確認每一個欄位的意義,判斷離群值出現的原因。
We could plot out the data (such as box plots, scatter plots, histograms), or look up the statistical quantity (5 values, mean, standard deviation, etc) to find out outliers. We need to try our very best to understand what every column's about, and figure out the reason why there are outliers.
出現離群值時,要小心處理,結合專業知識和統計學方法。先認真檢查原始數據,看能否從專業角度合理的解釋,如果數據存在邏輯錯誤而原始記錄又確實如此,並無法找該觀察對象核實資料,則只能選擇將觀測值刪除。如果數據間無明顯的邏輯錯誤,則可於離群值刪除前後各做一次統計分析,若前後結果不矛盾,該觀測值可予以保留。對於離群值,便可依上述情況,針對情況因應,常見有三種方式:捨棄欄位、取代補值、或採取捨棄整欄不使用。若判斷後決定取代填補離群值,則視情況以中位數、最大最小值或N/A等值取代,常用者以及函數整理:
We need to deal with outliers carefully, considering both the field knowledge and statistics. Have a thorough look over the data, and see if we could explain the outliers using field knowledge. If no, then we might have to give up the outlier, sometimes maybe even end up giving up the whole column. On the other hand, if the outliers do not seem too weird comparing to the rest of the data, we could try to analyse the data with and without the outliers to see the difference. So it actually really depends on the situation, normally, there are three ways to deal with outliers: remove the outliers, remove the whole column, or replace the outliers. The most commonly used values to replace outliers and the functions are as below:
First, generate some random values into a list.
# 載入所需模塊 import packages
import random
import numpy as np # 通常載入Numpy後會簡寫成np方便使用 import and abbreviate numpy as mp
from scipy import stats

# 生成一清單裝著20個指定範圍内的整數,指定兩數值包含且後數必須大於前數。
# create a list that contains 20 integers in 0 to 10.
arr = [random.randint(0,10) for i in range(20)]
print(arr)

通過把所有觀察值高低排序後找出正中間的一個(如果有偶數個數,則為最中間兩數相加再除2)。
The value separating the higher half from the lower half (if the numbers of the data is even, the median will be adding up the two numbers in the middle and divide it by two).
np.median(arr)

即把所有數值由小到大分成等份,q為用以指定介於(0, 1)之間百分位值。
Cut points dividing the range of a probability distribution into continuous intervals with equal probabilities. The parameter 'q' is a value between (0, 1) to specify the percentage.
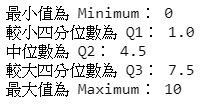
print('最小值為 Minimum:',np.quantile(arr, q=0))
print('較小四分位數為 Q1:', np.quantile(arr, q=0.25))
print('中位數為 Q2:', np.quantile(arr, q=0.5))
print('較大四分位數為 Q3:', np.quantile(arr, q=0.75))
print('最大值為 Maximum:', np.quantile(arr, q=1))
一組數據中出現次數最多的數據值。輸出結果包含眾數以及出現次數。
The value that occurs the most in the data. Output both the mode and the counts of the mode.
stats.mode(arr)

一組數或量相加總再除以該組數的個數。
Add up the values in data and divided by numbers of data.
np.mean(arr)

本篇程式碼請參考Github。The code is available on Github.
文中若有錯誤還望不吝指正,感激不盡。
Please let me know if there’s any mistake in this article. Thanks for reading.
Reference 參考資料:
[1] 第二屆機器學習百日馬拉松內容
[2] 離群值
[3] 離群值的檢測
