先來介紹如何讀入(.csv)檔、以及Pandas一些基本常用指令解說:
The first part will be about how to read in (.csv) files and some frequently used functions in Pandas.
演示程式碼讀入的是從網站下載的檔案。
The data in my code was downloaded from this site.
import pandas as pd # 載入套件並縮寫
df = pd.read_csv('example.csv') # 讀入後指定變數名稱df read in the file and name it df
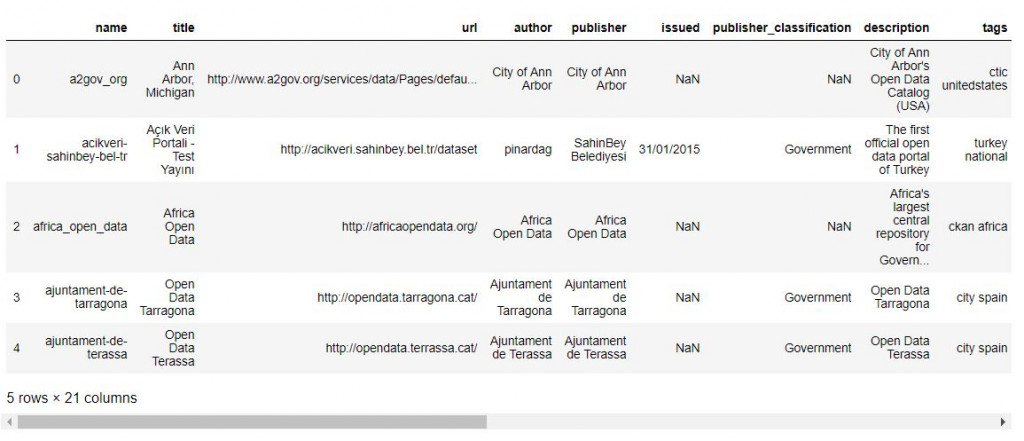
檔案讀進來後,使用一些基本指令來看一下資料,對資料有個概念。
After reading in the file, we can use some functions to have a look of what the data is like.
# .head()功能預設讀出資料中前五筆,裡面可以裝整數,看要讀取前幾筆
# .head() will select the top n rows of the data, leave blank to get 5
df.head()
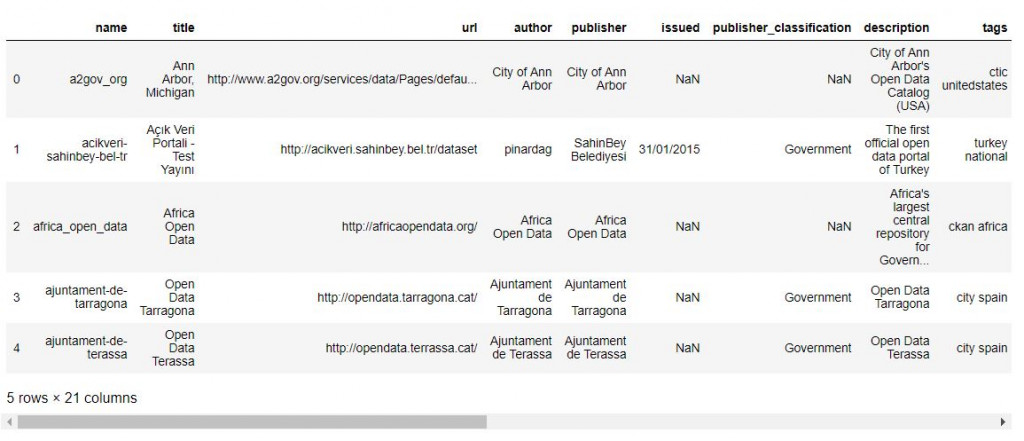
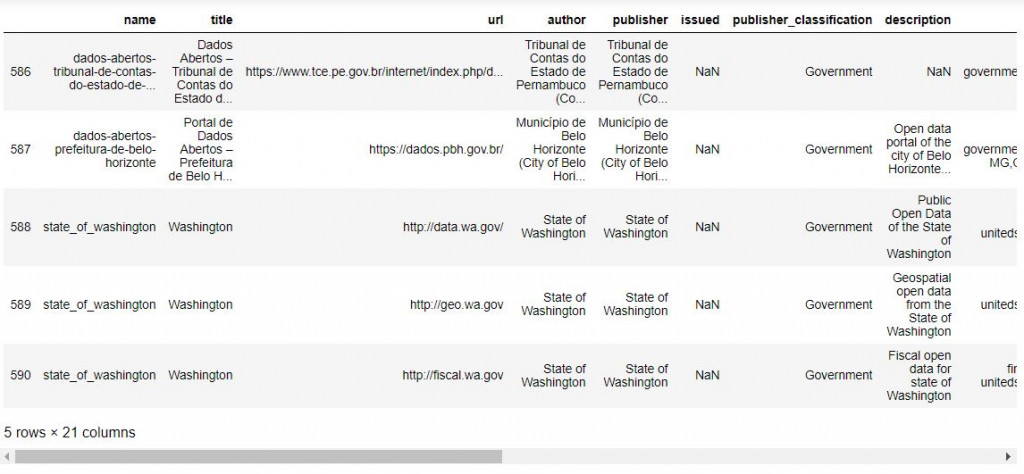
# .tail()功能則是預設讀出資料中最後五筆,裡面可以裝整數,看要讀取最後幾筆
# .tail() on the other hand will select the bottom n rows of the data, leave blank to get 5
df.tail()
# .iloc[a:b] 叫出指定列,清單中頭值包含,尾值不包含
# .iloc[a:b] select rows by position. a included, b not included.
df.iloc[2:4]

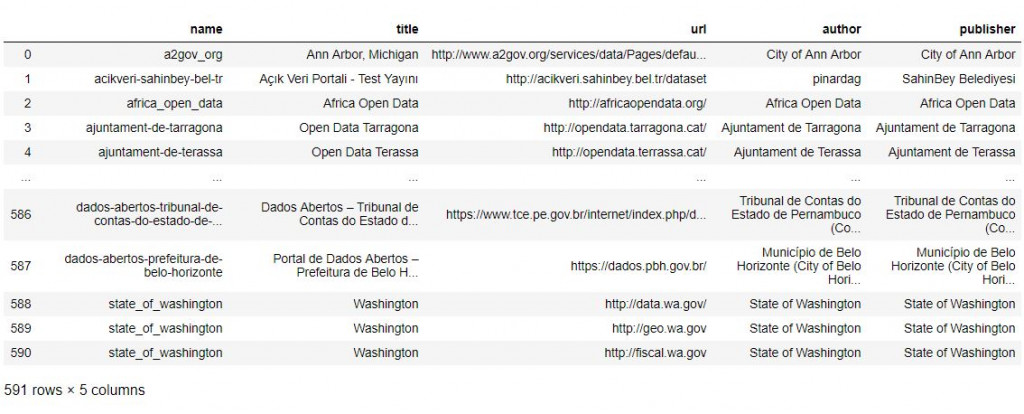
# .iloc[a:b, c:d] 叫出[指定欄, 指定列]
# .iloc[a:b, c:d] select [rows, columns]
df.iloc[:, :5] # 叫出所有列,叫出前五欄 select all rows, the top five columns
# .iloc[[], []] 叫出[指定欄, 指定列]
# .iloc[[], []] select [[rows], [columns]]
df.iloc[[0], [0, 1, 2]]

# .index叫出每列名稱
# .index will select the head of rows
df.index

# .columns叫出每欄名稱
# .columns will select the head of columns
df.columns

# .shape看資料框架有幾欄幾列
# .shape will call the dimension of the DataFrame
df.shape

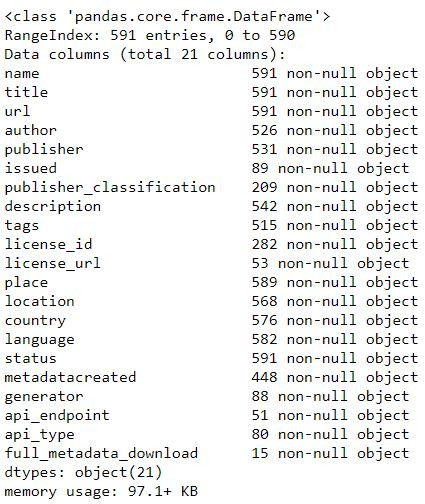
# .info查看資料框架的一些資訊
# .info will call the some information of the DataFrame
df.info()
with open('example.txt', 'r') as ex: # ’r’表示讀入 'r' means read in mode
    data = ex.readlines() # 逐行讀取並存成data read each lines and save as data
print(data)

# CV2的速度較快,但色彩模式會以BGR讀入 CV2 reads faster but in BGR mode
import cv2
import numpy as np
import matplotlib.pyplot as plt
image = cv2.imread('example.jpg')
image = cv2.cvtColor(image, cv2.COLOR_BGR2RGB)
# 轉成RGB再存回變數 remember to convert to RGB mode and save back to variable
image = np.array(image) # Convert img to numpy array
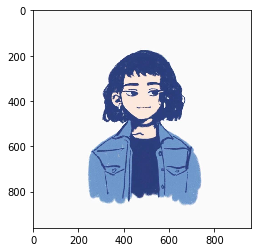
plt.imshow(image)
plt.show()
from PIL import Image
image = Image.open('example.jpg')
image = np.array(image) # Convert img to numpy array
plt.imshow(image)
plt.show()

import skimage.io as skio
image = skio.imread('example.jpg')
image = np.array(image) # Convert img to numpy array
plt.imshow(image)
plt.show()

import scipy.io as sio # 載入Scipy
data = sio.loadmat('example.mat')
import numpy as np
arr = np.load('example.npy')
import pickle
with open('example.pkl', 'rb') as ex:
arr = pickle.load(ex)
import json # 先載入套件
with open('example.json','r') as ex:
data = json.load(ex)
本篇程式碼請參考Github。The code is available on Github.
文中若有錯誤還望不吝指正,感激不盡。
Please let me know if there’s any mistake in this article. Thanks for reading.
Reference 參考資料:
[1] 第二屆機器學習百日馬拉松內容
[2] DataFrame
[3] Berlin Open Data
