身為一個鍵盤柯南,最重要的技能之一就是儲存和下載分析後的結果。另外chart.js其他對於圖表的控制,包含更新、清除、摧毀、顯示和隱藏資料組,也會記錄在今天筆記內。
chart.js提供toBase64Image可將圖表轉成圖像,其中要特別注意預設並沒有設定圖表的背景顏色,所以存成PNG時會是透明的,但存成JPEG會是黑的:
myChart.toBase64Image();
// => returns png data url of the image on the canvas
myChart.toBase64Image('image/jpeg', 1)
// => returns a jpeg data url in the highest quality of the canvas
然後我們可以參考此篇說明,創造一個 Anchor元素,並將href設為該圖像,然後click function則會觸發下載(download為儲存檔名,瀏覽器可以設定是自動下載或是有選擇框):
	let tempA = document.createElement('a');
	tempA.href = myChart.toBase64Image(); //save as png
	tempA.download = 'chart.png';
	tempA.click();
以昨天畫迴歸線為例,當我們造好新的dataset後,我們用push將資料組放進去,然後需要更新圖表,即update這個功能:
chart.data.datasets.push(newDataset);
chart.update();
其他若要刪除資料組,或是新增和刪除資料點,同樣更新資料後,再用update更新圖表,若資料有變化,則更新時會有動畫,若資料沒變化,則先reset後再一次update則會有動畫。clear則是清除圖表畫面,但資料還在,所以再執行update就會在顯示出來。
在一開始建立圖表時要new Chart,new完後就無法對同一個canvas的id在new Chart了,若要重new,必須要先destroy。
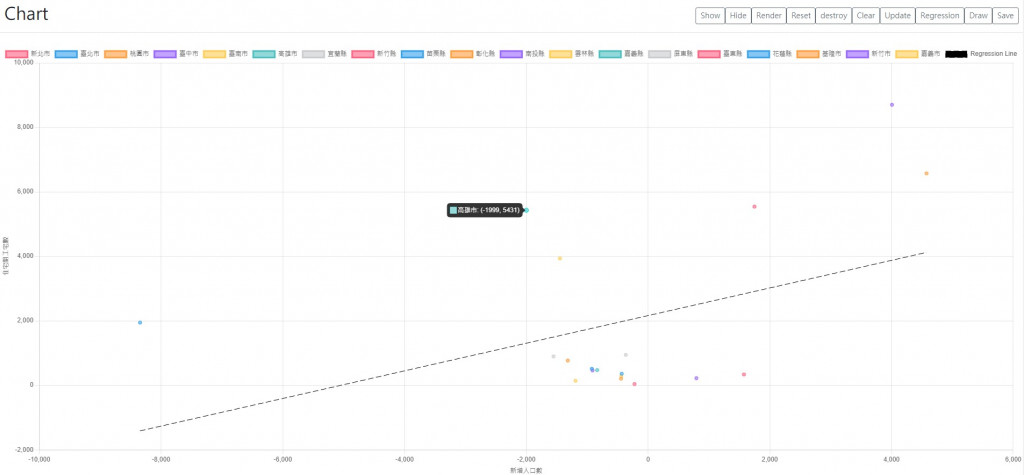
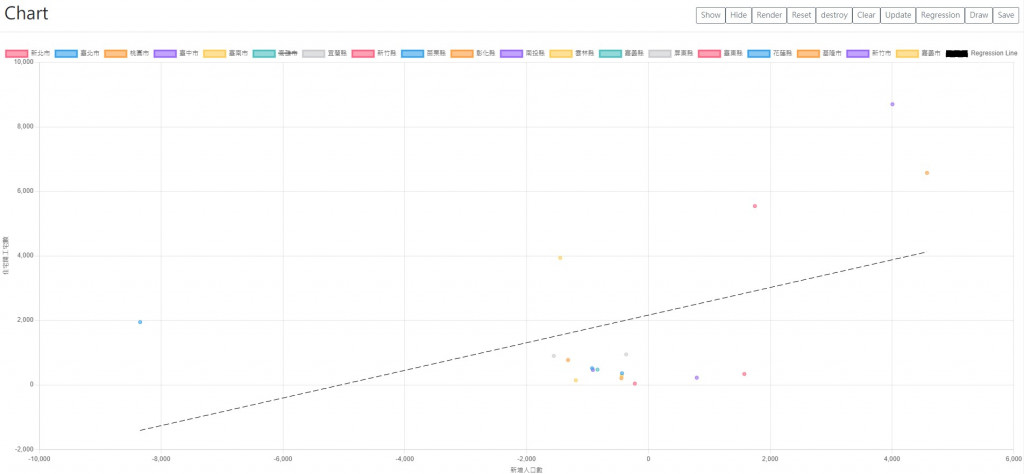
chart.js可以對資料組顯示或隱藏:
chart.hide(1); // hides dataset at index 1 and does 'hide' animation.
chart.show(1); // shows dataset at index 1 and does 'show' animation.
而這個功能除了可以用JavaScript控制,也可以直接在頁面上控制,點選圖例的該資料組名稱,就會切換隱藏和顯示,隱藏後在圖例的該資料組就會有刪除線: