在 Claus O. Wilke 的《Fundamentals of Data Visualization》一書中提到:將資料對應於結果圖形的可量化特徵值上,就是資料視覺化。這些特徵可以被稱作 美學映射(aesthetics) 或 視覺呈現。換個角度思考,這一點的重要性也反映在 ggplot2 的結構設計中 —— aes() 幾乎是每一張圖必不可少的元素。
在資料視覺化中,位置(Position)、形狀(Shape) 與 顏色(Color) 是最基本且關鍵的三種映射元素。這些元素透過 尺度(Scales) 來建立資料與視覺之間的橋樑。例如,連續型數據可以被映射成顏色的深淺變化,或點的座標位置;類別型數據則可能被映射成不同的顏色或形狀。
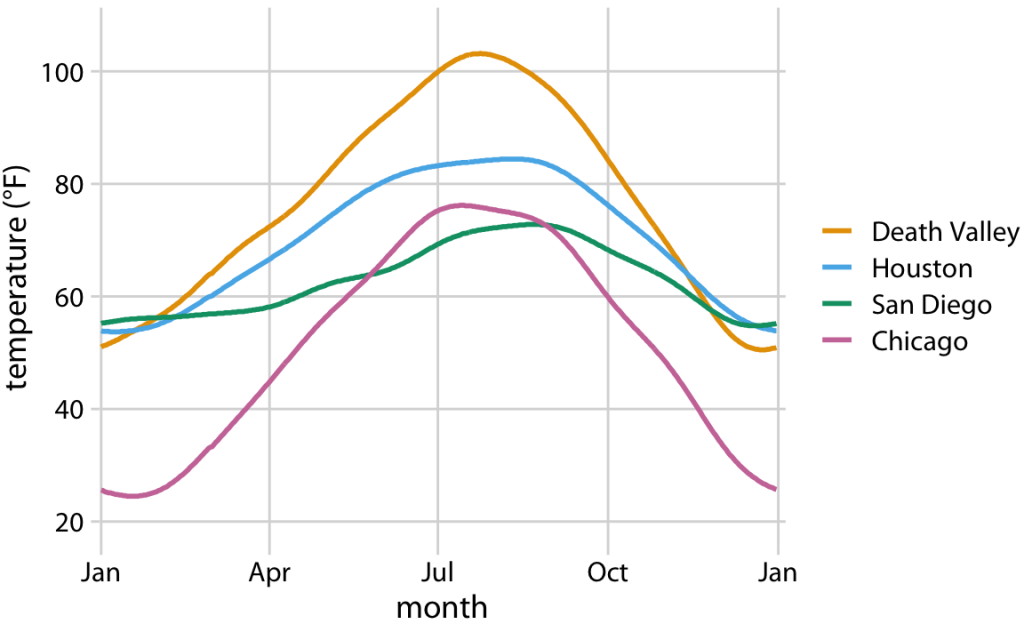
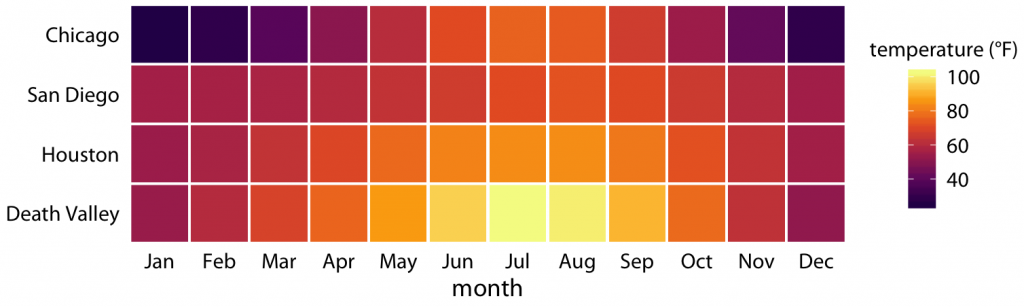
假設我們想比較四個地區在一年 12 個月中的平均氣溫:不同的尺度組合,會帶給讀者完全不同的解讀角度。
在資料視覺化的設計中,有一個經典原則:比例墨水原理(the principle of proportional ink)。其核心思想是:當使用上色區域來表示數值時,該區域的面積應該與數值成正比。
換句話說,視覺化結果所傳達的特徵必須與真實數據對應,否則可能導致誤導性的解讀。
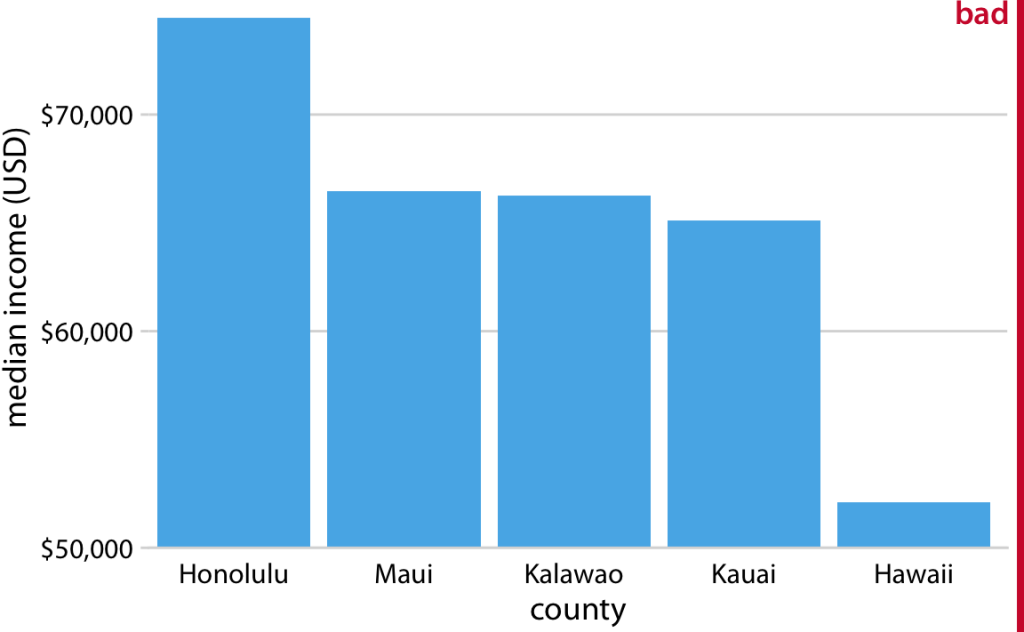
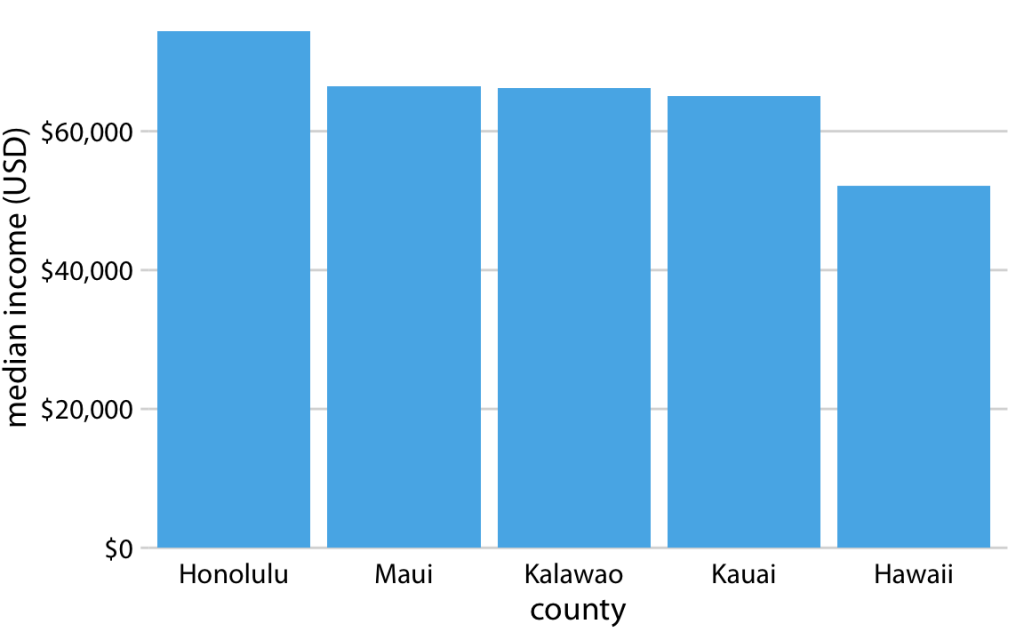
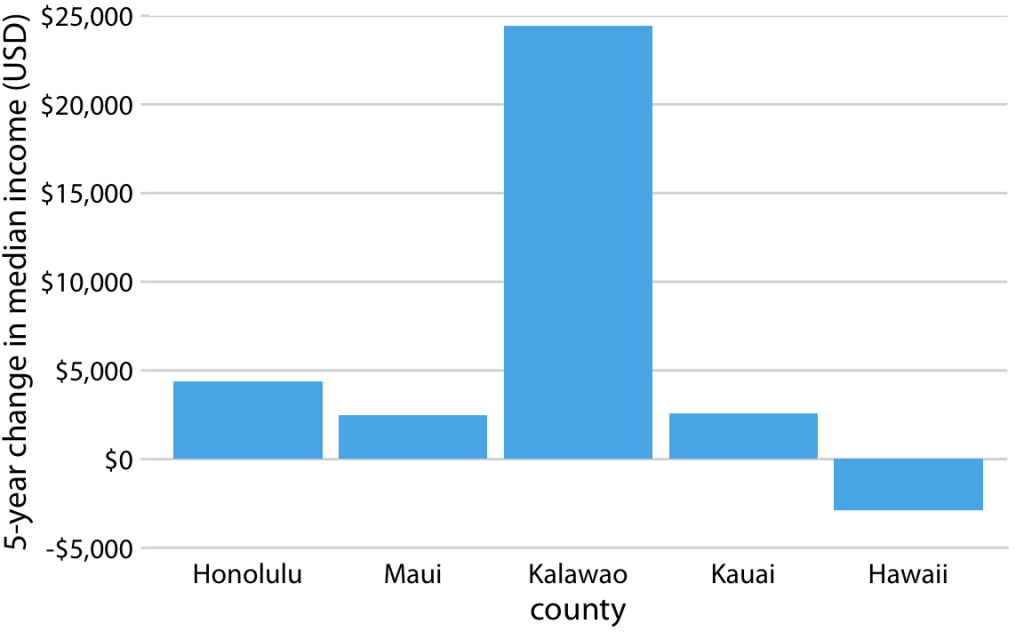
假設要比較美國不同地區的收入水準:
在這裡,長條高度要能忠實表達數據,避免造成誤解。
今天我們從 aes() 出發,認識了資料與視覺化之間的連結。三大要素 —— 位置、形狀、顏色,透過尺度形成了數據與圖像的對應。同時,也強調了 比例墨水原理,提醒我們在設計圖表時,務必要讓視覺化的面積與真實數值保持一致,才能避免誤導觀眾。
資料視覺化不只是「美感」的呈現,更是「正確傳達」的責任。
This article examines the connection between data and visualization, inspired by Claus O. Wilke’s Fundamentals of Data Visualization. In ggplot2, the aes() function plays a crucial role, linking data variables to visual elements. Three core aesthetics—position, shape, and color—form the basis of visual encoding, with scales serving as the mechanism that maps data to graphical properties.
Using temperature data across different regions as an example, the article demonstrates how varying aesthetic mappings produce distinct interpretations. Assigning temperature to the y-axis versus using cities as categorical variables changes the way trends and comparisons are perceived.
The discussion highlights the principle of proportional ink, which states that the graphical area used to represent data values must remain proportional to the underlying numbers. When bar charts start from a non-zero baseline, differences in income may appear exaggerated, while using zero as a baseline ensures a more faithful representation. Nonetheless, when focusing on differences rather than absolute values, a non-zero baseline can still be appropriate.
Finally, the article illustrates how using bar height—rather than area—to represent income levels prevents misleading interpretations. The key takeaway is that data visualization must go beyond aesthetics to fulfill its responsibility of truthfully conveying information.

