在資料視覺化的旅程中,圖表從來不只是圖表,它是我們與觀眾對話的橋樑,更是讓數據真正「說話」的方式。Claus O. Wilke 的《Fundamentals of Data Visualization》第 29 章提到:好的視覺化,不只要正確,還要會「講故事」。
想要說明arXiv.的預印伺服器使用狀況, 其中2014年後開始平緩狀態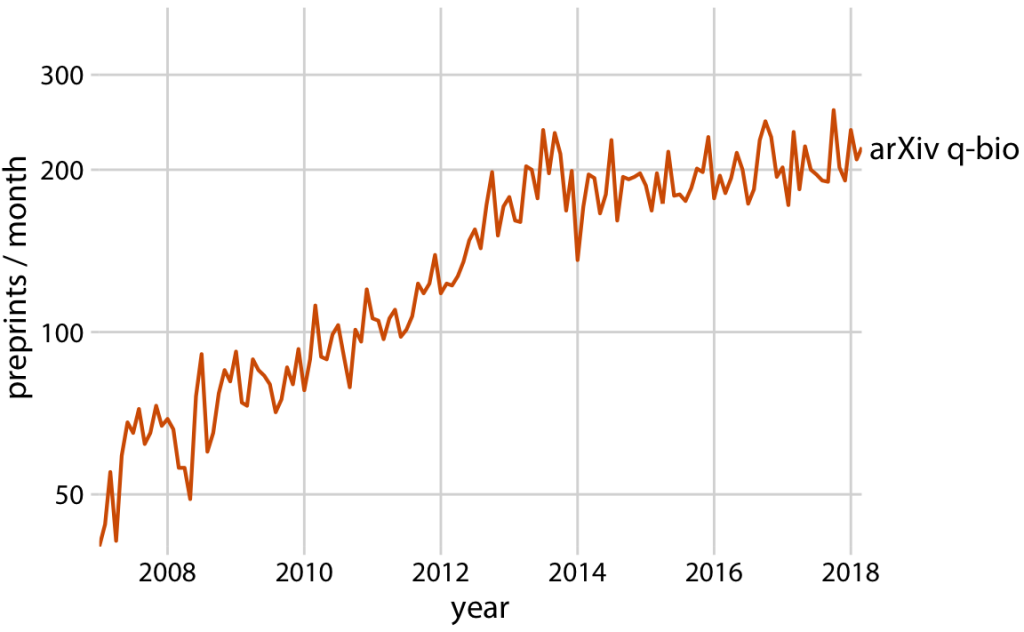
Wilke 提醒我們,不要預設觀眾有時間或耐心去解讀複雜圖表。建議的設計原則是:
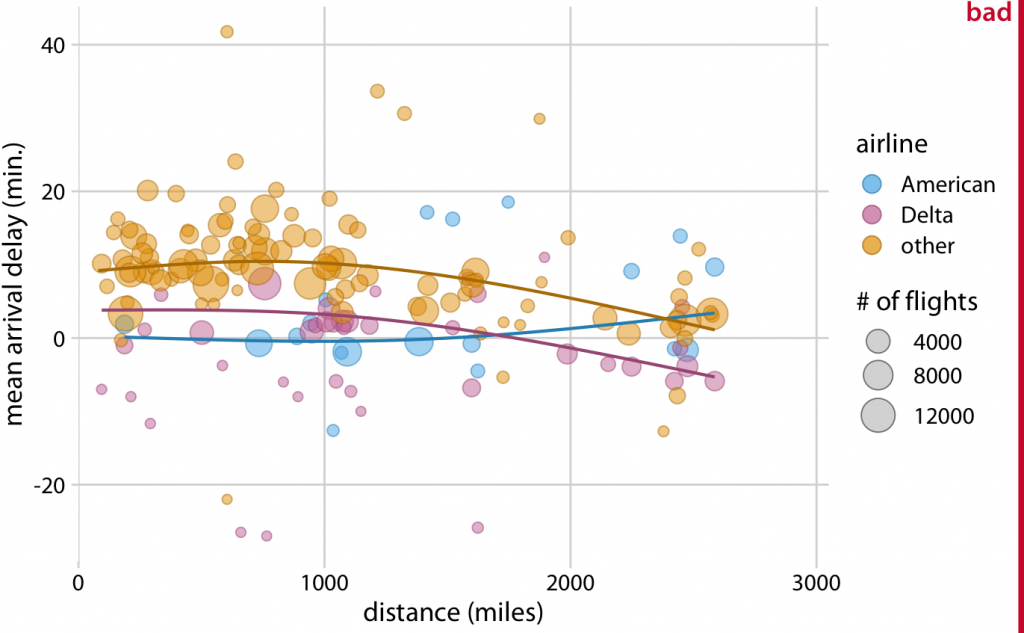
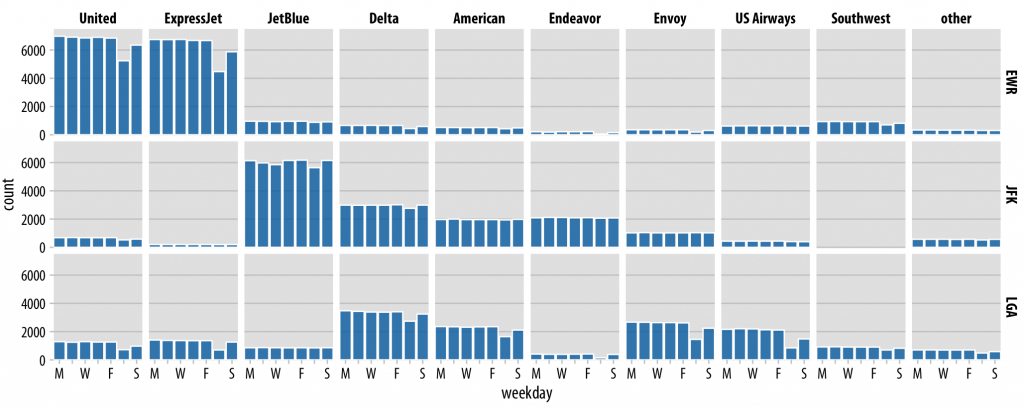
例如: 2013年從紐約市區起飛的抵達延遲圖形, 其實不容易秒懂, 因為包含太多資訊
透過下列兩張,可以用很清楚的圖, 分別呈現美國航空與達美航空的延遲狀況與航班數量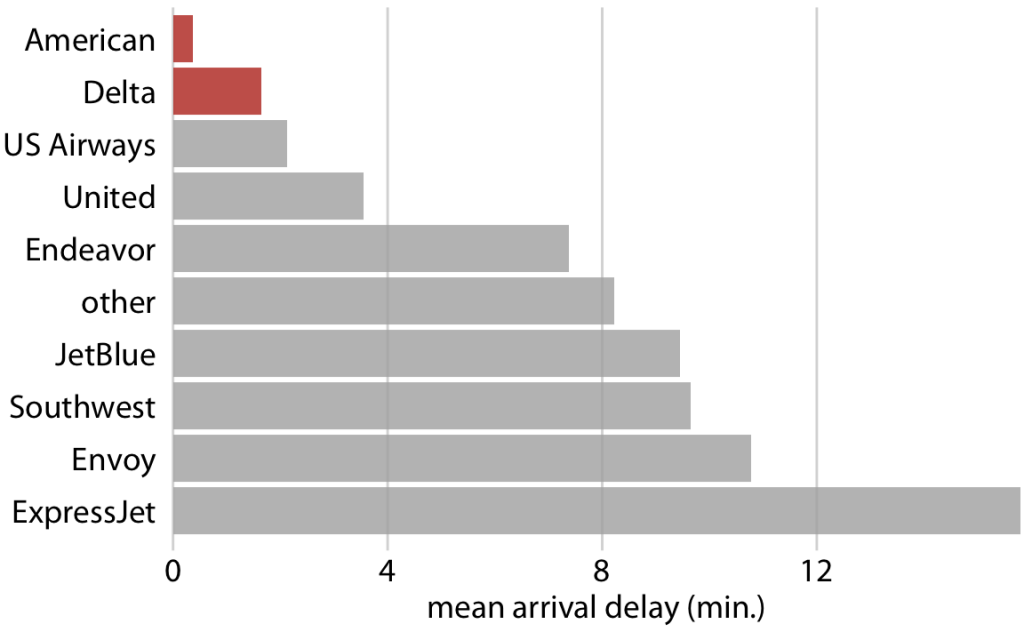
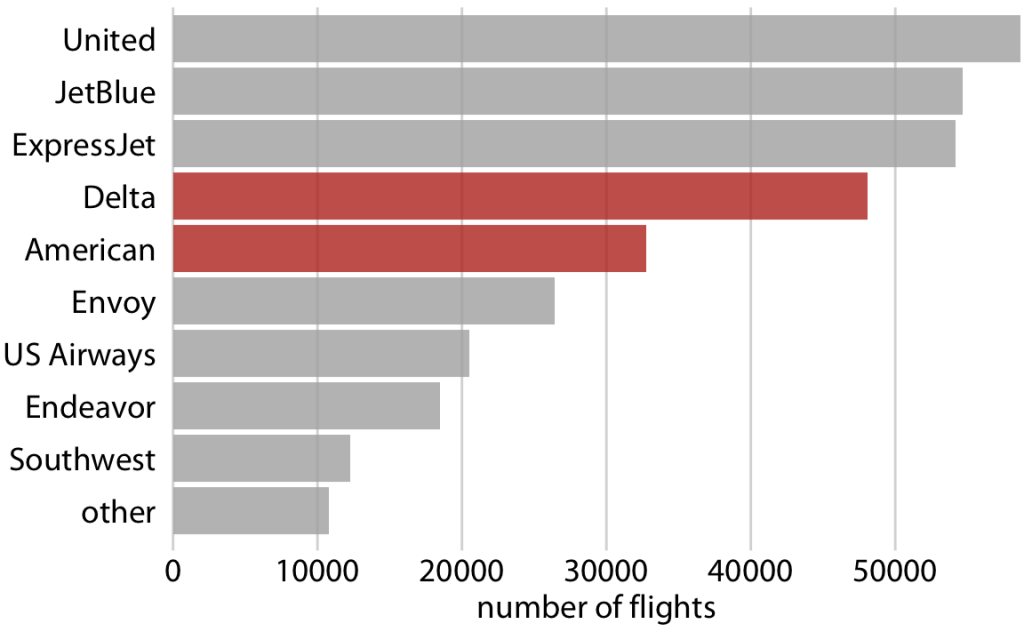
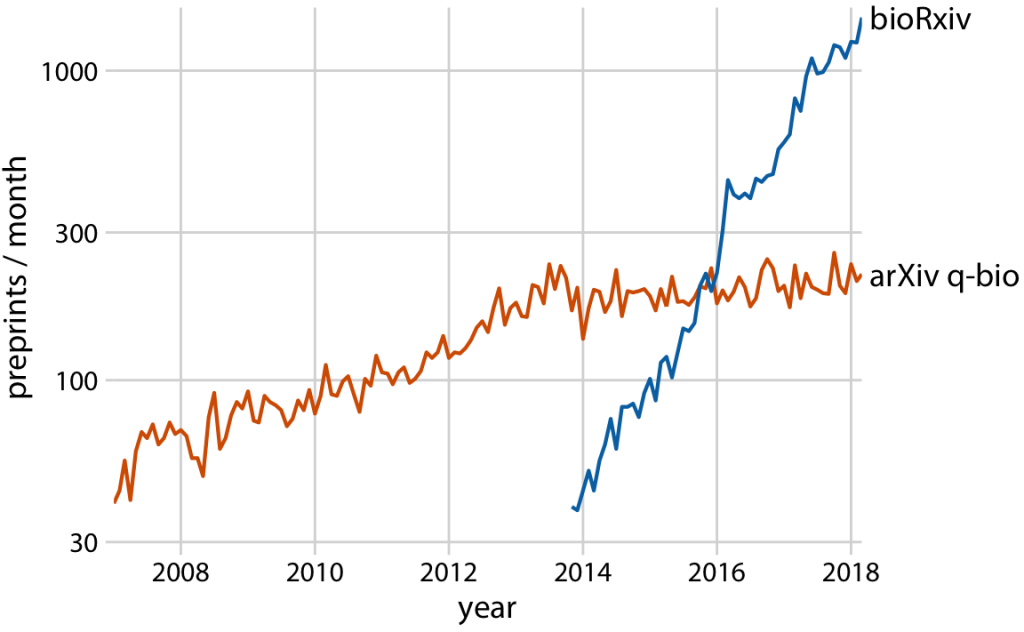
當需要呈現多維度或複雜關係時,先給觀眾看簡單版本,再逐步帶入全貌。例如 small multiples,可以先展示單一圖,再擴展成多張並列,減輕讀者負擔。
先簡單由單一航空的起飛航班數量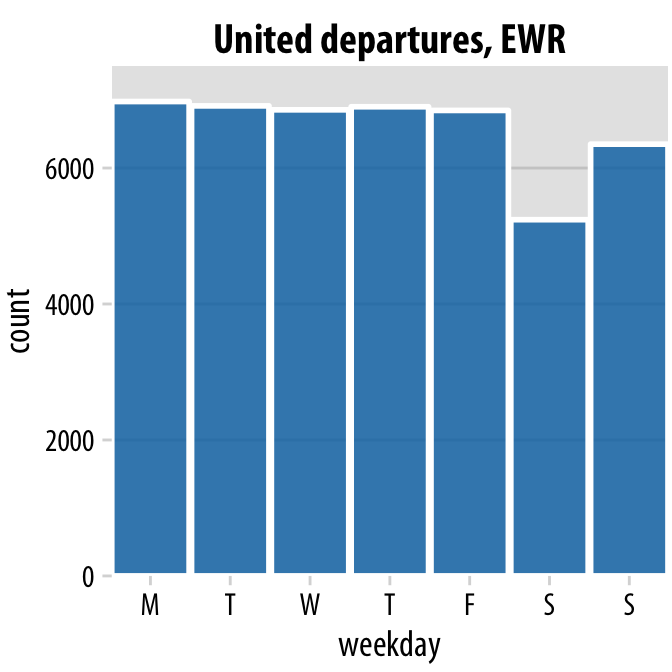
資料視覺化的核心,不是「炫技」而是「說服」。讓數據帶著故事走,讓圖表講出觀眾能理解與記住的重點,才是真正的價值。
This chapter emphasizes the importance of storytelling in data visualization. Charts are not merely technical outputs; they are the medium through which data communicates meaning to the audience. According to Claus O. Wilke in Fundamentals of Data Visualization, effective visualizations must not only be accurate but also capable of telling a story. Stories attract attention, improve understanding, and help audiences remember insights. Different narrative structures—such as “opening–challenge–resolution” or “background–development–climax–ending”—can be used to frame data-driven messages. Since a single figure rarely captures the entire story, multiple charts are often needed to build a coherent narrative arc. Clarity should always take priority over complexity: visualizations must be instantly interpretable, stripped of unnecessary elements, and designed so that anyone can grasp the key message quickly. When complexity is unavoidable, it is best introduced gradually, starting with a simple view and progressing toward more detailed depictions, such as small multiples. To improve memorability, visual elements such as meaningful icons can be integrated, though excessive decoration should be avoided. Consistency across related charts ensures cohesion, while differentiation prevents confusion when addressing separate topics. Ultimately, data visualization is less about showing off technical skills and more about persuasion: guiding the audience through a clear and memorable story.

