import numpy as np
import matplotlib.pyplot as plt
import seaborn as sns
from sklearn.linear_model import LinearRegression
sns.set() #設定繪圖模板
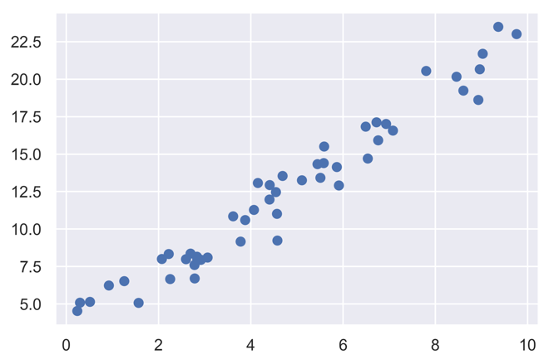
先由簡單線性迴歸模型的資料模擬開始,利用y = ax + b的方式生成資料,以下為散佈在斜率為2,截距為3的直線上,加上隨機生成的數值產生的模擬資料。
rng = np.random.RandomState(3)  #設定種子,在rng下生成資料就不用重複設定
x = 10 * rng.rand(50)           #rand() 生成0~1之間的隨機數
y = 3 + 2 * x + rng.randn(50)   #randn()生成常態分佈的隨機數
plt.scatter(x, y)               #畫出x與y的散佈圖
plt.show()
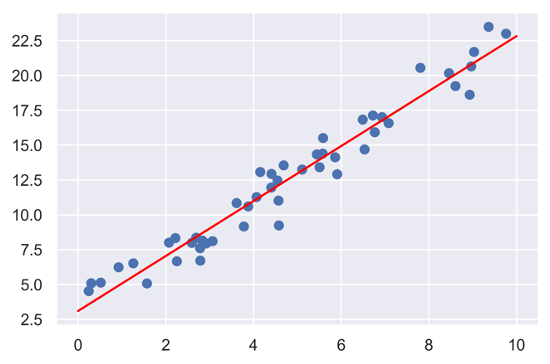
model = LinearRegression(fit_intercept = True)

model.fit(x[:, np.newaxis], y)             #將x的資料轉換為一個column,建立模型

xfit = np.linspace(0, 10, 1000)            #生成1000個0~10的等差數列
yfit = model.predict(xfit[:, np.newaxis])  #以建立好的模型生成相對應的預測值

plt.scatter(x, y)
plt.plot(xfit, yfit, color = "red")        #畫出建立好的迴歸直線
plt.show()
模型參數:
print("Slope:", round(model.coef_[0], 3))
print("Intercept:", round(model.intercept_, 3))
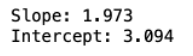
因一開始生成資料時假設資料為線性的,因此得到的結果與我們設定的截距與斜率非常接近。
rng = np.random.RandomState(1)
X = 10 * rng.rand(10, 3)          #生成10x3的X
y = 0.5 + np.dot(X, [1.5, -2, 1]) #np.dot()執行矩陣乘法

model = LinearRegression(fit_intercept = True)
model.fit(X, y)

print(round(model.intercept_, 2))
print(model.coef_)


 iThome鐵人賽