這幾次介紹了svm支援向量機、隨機森林 等機器學習模型。在建立模型時可以發現我們能把模型的結構建的很複雜,包括使用 kernal fuction 轉換、抽樣建多個模型再統整等等,更不用說如果去建立深度學習時,被稱為黑盒子的模型表達會有多困難。
今天如果想將模型的分類、預測結果講解給非相關領域的人理解時,結果說明以及為何模型會如此判斷是一個大重點。所以今天打算介紹 LIME 的應用,透過 LIME ,他可以用簡單好懂的方式告訴大眾為什麼模型會給你這個判斷結果。
LIME 詳細的說明可以參考:
“Why Should I Trust You?” Explaining the Predictions of Any Classifier,以及github的程式碼和範例。
LIME (Local Interpretable Model-agnostic Explanations),顧名思義它可以應用於各種模型(包含神經網路等等的深度學習模型),然後去解釋為何模型會對這筆資料有這樣的預測判斷。
LIME, an algorithm that can explain the predictions of any classifier or regressor in a faithful way, by approximating it locally with an interpretable model.
* “Why Should I Trust You?” Explaining the Predictions of Any Classifier*
和昨天提到的隨機森林中可以計算得知重要變數不同, LIME 是對局部的資料作解釋。除此之外,它不只告訴你影響的重要變數,它能提供你更多判斷資訊。
因此,當我們知道模型是依據什麼原因去做分類/預測時,我們可以進一步靠我們的專業知識直覺的評論這個模型可不可信任。
這裡推薦一個不錯的解釋影片去了解 LIME :
以下範例和昨天一樣,打算以隨機森林建模,使用 Breast Cancer Dataset。
目標變數Target 分為兩類'malignant'惡性, 'benign'良性腫瘤,為二元分類問題。
資料集內含有30個連續型的解釋變數,共有569筆資料。
資料來源:Breast Cancer Wisconsin (Diagnostic) Data Set。
載入套件:
import pandas as pd
import numpy as np
import matplotlib.pyplot as plt
import seaborn as sns
import statsmodels as sm
## Common imports
import sys
import sklearn # scikit-learn
import os
import scipy
## plot
import matplotlib as mpl
import matplotlib.pyplot as plt
## 分割資料
from sklearn import datasets
from sklearn.model_selection import train_test_split
## modelbuilding 模型套件
from sklearn.ensemble import RandomForestClassifier
載入資料:
from sklearn.datasets import load_breast_cancer
breast_cancer=datasets.load_breast_cancer()
x, y = datasets.load_breast_cancer(return_X_y=True)
x_train,x_test,y_train,y_test=train_test_split(x,y,test_size=0.2)
LIME套件各函式的詳細說明可以參考網站。
以下開始簡單的示範:
使用 LIME套件時,要先到 Anaconda Prompt 執行以下程式碼安裝套件。
pip install lime

或是
conda install -c conda-forge lime
安裝完成後,使用 Python 載入lime和lime.lime_tabular套件。
import lime
import lime.lime_tabular #explainer object
然後建立隨機森林模型:
## Random Forest Classifier model
model = RandomForestClassifier(n_estimators=300,max_features=5,random_state=0)
model.fit(x_train, y_train)
predictions = model.predict(x_test)
# Evaluate predictions
# # 0:'setosa', 1:'versicolor', 2:'virginica'
print(accuracy_score(y_test, predictions)) #準確率
print(confusion_matrix(y_test, predictions)) # 混淆矩陣confusion matrix
print(classification_report(y_test, predictions)) # 模型報表結果
print(sklearn.metrics.f1_score(y_test, predictions, average='binary')) # F score
lime 資料解釋:
class_names =datasets.load_breast_cancer(as_frame=True).target_names
feature_names=datasets.load_breast_cancer(as_frame=True).feature_names

explainer =lime.lime_tabular.LimeTabularExplainer(
    training_data = x_train,
    feature_names = feature_names,
    class_names = class_names,
    mode='classification') # “classification” or “regression”
我們拿test data的第一筆資料做示範
exp = explainer.explain_instance(
data_row = x_test[0], # test data 的其中一筆資料
predict_fn=model.predict_proba
)
exp.show_in_notebook(show_table=True) # 視覺化顯示
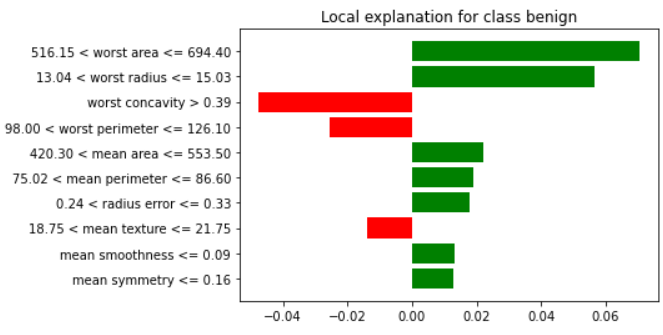
exp.as_pyplot_figure()
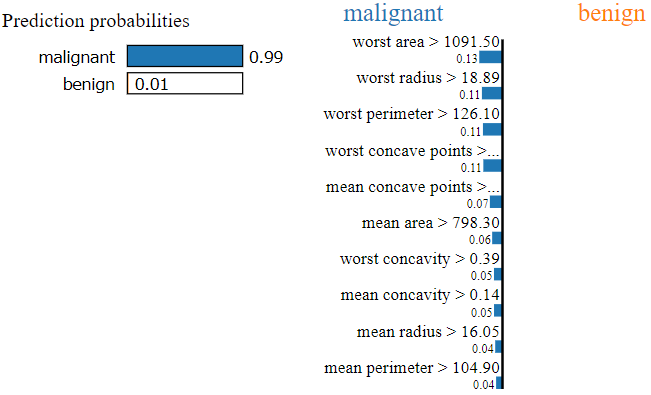
可以看到模型認為有99%它會是為 "malignant" 惡性腫瘤,造成這樣判斷的原因最主要會是因為 worst area, worst radius, worst perimeter, worst concave points,...。
其中這些影響變數在這位患者身上對應到的數值為: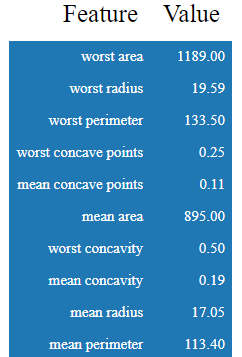
本資料對於分類為"良性"這個類別,皆為負影響: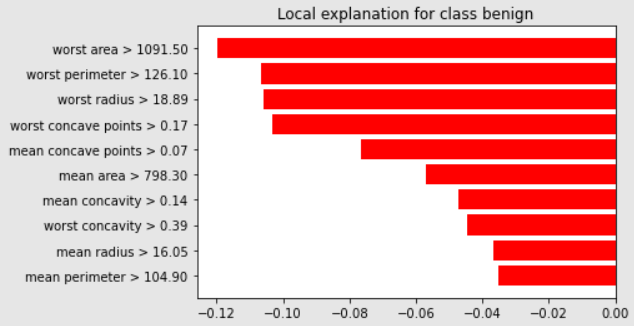
也可以看看其他的測試資料:
exp = explainer.explain_instance(
    data_row=x_test[1],
    predict_fn=model.predict_proba
)

exp.show_in_notebook(show_table=True)
exp.as_pyplot_figure()

exp = explainer.explain_instance(
    data_row=x_test[2],
    predict_fn=model.predict_proba
)

exp.show_in_notebook(show_table=True)
例如這筆資料的模型分類結果顯示有 84% 為良性的: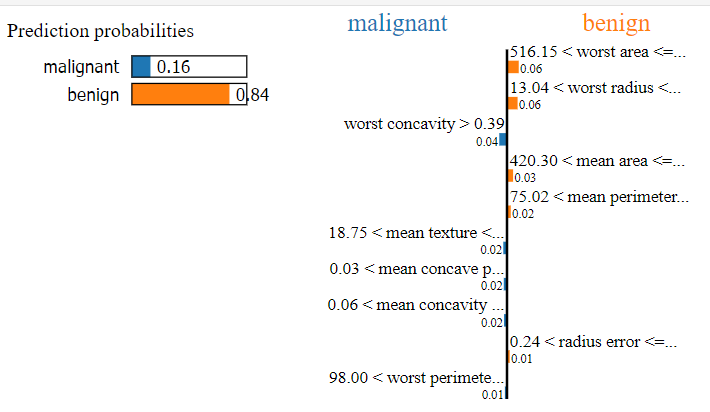
而這位病人的腫瘤則較有可能被分為良性: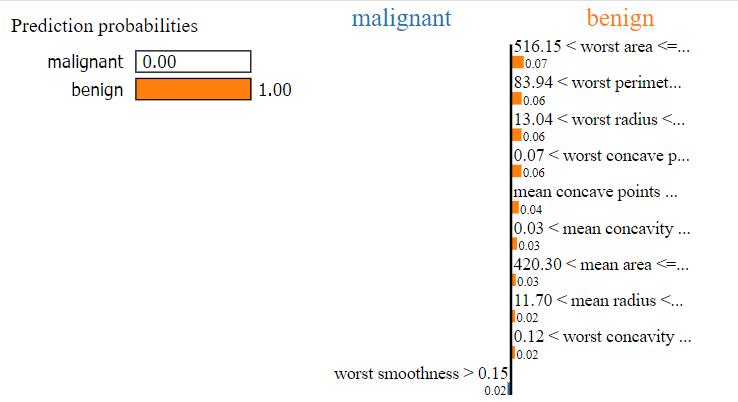
對於迴歸問題的應用可以參考網路上Boston data 迴歸預測問題的範例by Eric D. Brown, D.Sc.。
對於文本分類問題的應用可以參考網路上文本分類問題20 newsgroups dataset的範例。
對於多元分類問題的應用可以參考 網路上文本分類問題20 newsgroups dataset的範例。
LIME: How to Interpret Machine Learning Models With Python(@Dario Radečić)
https://betterdatascience.com/lime/
Local Interpretable Model-agnostic Explanations – LIME in Python (@Eric D. Brown, D.Sc.)
https://pythondata.com/local-interpretable-model-agnostic-explanations-lime-python/