今天是鐵人第17天,前幾天學習了一些Matplotlib的繪圖,今天要畫一個簡單的股票價格圖表,首先要讓Matplotlib可以顯示中文。還有介紹一些其他的圖表。
import matplotlib
matplotlib.matplotlib_fname()
# 輸出結果
'C:\\Users\\lasts\\Anaconda2\\envs\\env_Python3.6\\lib\\site-packages\\matplotlib\\mpl-data\\matplotlibrc'
將剛剛下載的ttf放到 C:\Users\lasts\Anaconda2\envs\env_Python3.6\lib\site-packages\matplotlib\mpl-data\matplotlibrc\fonts\ttf ,需要改成英文檔名「test-font.ttf」(可以自己定義名稱),中文檔名好像會失敗,筆者自己試會這樣,如果有試出來,在講一下,感謝。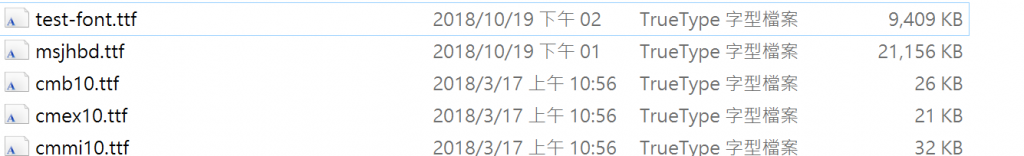
關閉Jupyter notebook,並且刪除暫存檔,windows這裡是在 C:\Users\lasts\ .matplotlib ,直接刪除.matplotlib這個資料夾
再次打開Jupyter notebook,執行以下的語法(主要是要產生fontList.json這個檔案)
import matplotlib.pyplot as plt
fig = plt.figure()
plt.plot([1,2,3], '-')
plt.title('台積電 2016年收盤價曲線',loc='right')
,會看到剛剛刪除的C:\Users\lasts.matplotlib資料夾會重新產生,之後打開C:\Users\lasts.matplotlib\fontList.json,收尋剛剛改的檔案名稱「test-font.ttf」,會看到name是「DFPTongTong-B5」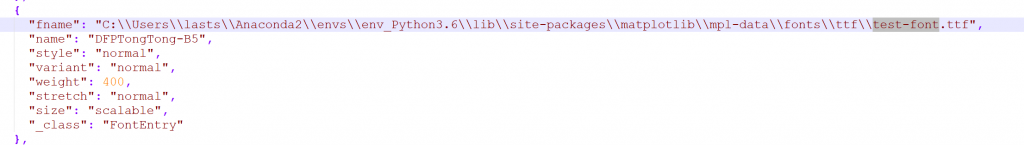
打開 C:\Users\lasts\Anaconda2\envs\env_Python3.6\lib\site-packages\matplotlib\mpl-data\matplotlibrc 這個檔案,並尋找 font.family,拿掉#字號,並且改成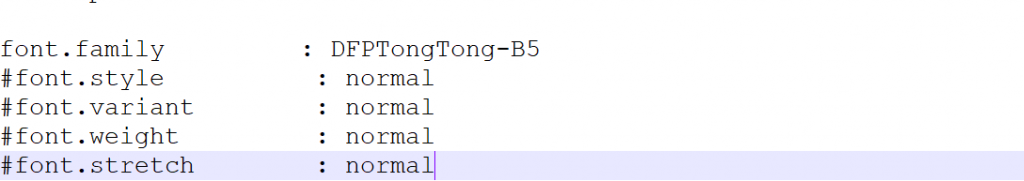
重新啟動Jupyter notebook,之後執行example1的範例,即可看到文字已經改變,這個只是示範某個字體,筆者自己主要還是使用微黑正體
import pandas as pd
import matplotlib.pyplot as plt
%matplotlib inline
TSMC = pd.read_csv('2330stk.csv', sep='\t', index_col='Date')
TSMC.index = pd.to_datetime(TSMC.index) # 把index轉成datetime型態
Close = TSMC.Close
Open = TSMC.Open
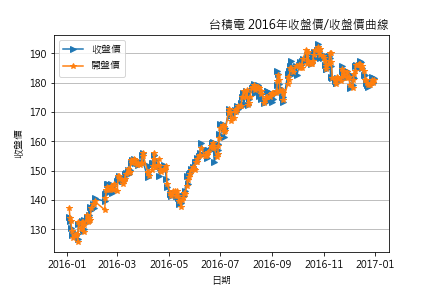
fig = plt.figure()
plt.plot(Close['2016'], '-' , label="收盤價", marker=">")
plt.plot(Open['2016'], '-' , label="開盤價", marker="*")
plt.title('台積電 2016年收盤價/收盤價曲線',loc='right')
# loc->title的位置
plt.xlabel('日期')
plt.ylabel('收盤價')
plt.grid(True, axis='y')
plt.legend()
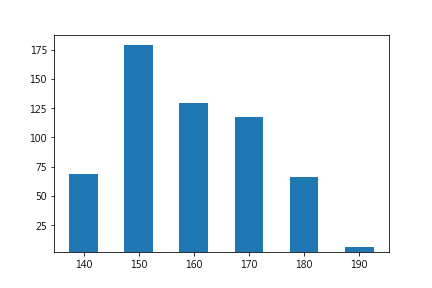
可以顯示每個數據區間坐落的樣本數。
語法:pyplot.bar(x, height, width, bottom, *args)
x-> 設定x軸
height->高度
width-> 寬度
bottom-> 柱子底部的y座標
範例:顯示台積電2016年的收盤價在哪個區間比較多
barValue = [0,0,0,0,0,0]
for i in Close:
    if i > 190:
        barValue[5]+=1
    if i > 180:
        barValue[4]+=1
    if i > 170:
        barValue[3]+=1
    if i > 160:
        barValue[2]+=1
    if i > 150:
        barValue[1]+=1
    else:
        barValue[0]+=1
fig = plt.figure()
plt.bar([140,150,160,170,180,190], height=barValue , width=5.2, bottom=2.0)
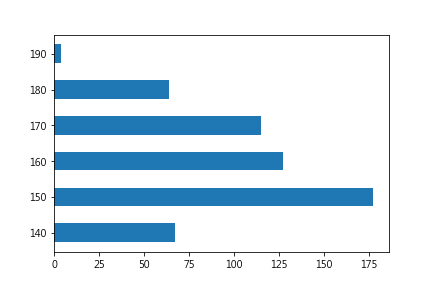
用相同的數據繪製水平的柱狀圖
語法:bar(y, width, height, *args)
y-> 設定x軸
width->寬度
height-> 高度
fig = plt.figure()
plt.barh([140,150,160,170,180,190], barValue , height=5.2)
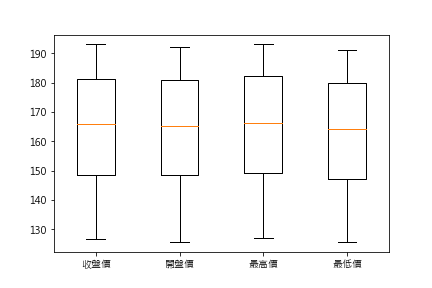
語法:pyplot.boxplot(x, *args)
x-> 數據
使用台積電的開盤價、最高價、最低價、和收盤價這四個數據來繪製
import numpy as np
boxData = TSMC.iloc[:,:4]
fig = plt.figure()
plt.boxplot(np.array(boxData), labels=('收盤價','開盤價','最高價','最低價'))
版主大大,
實習到這邊....有點小卡卡
可以請版大提供'2330stk.csv'檔案嗎?
超級無敵~~大感恩~~
後續有教如何抓取哦,而且有 github 連結
台積電 2016年『開盤』價/收盤價曲線
另外字體大小設定踩到的坑:
plt.rcParams.update({'font.size': 8,'font.sans-serif':'Taipei Sans TC Beta'})
沒有設定的話,你 fontsize 不管如何設定都無效