今天是鐵人的第19天,前一天介紹了seaborn,今天要來介紹seaborn更進一步的設定->style樣式的設定。
下面例子顯示當設定不同的style所呈現出來的風格
事先執行的程式碼
ironman_np_x = np.linspace(1, 14, 100) #產生一個1~14的等差數列
ironman_np_y1 = np.sin(ironman_np_x)
ironman_np_y2 = np.sin(ironman_np_x+2)*1.25

def drawPlot():
    plt.plot(ironman_np_x, ironman_np_y1)
    plt.plot(ironman_np_x, ironman_np_y2)

def drawPlotFour():
    for i in range(4):
        plt.plot(ironman_np_x, np.sin(ironman_np_x+i)*(i+0.75), label="sin(x+i)*(i+0.75)")
    plt.legend()
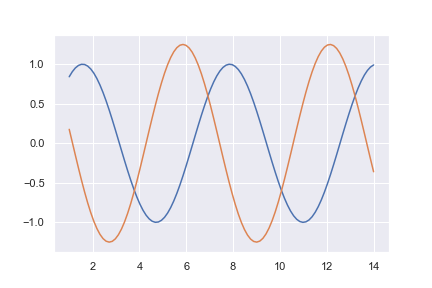
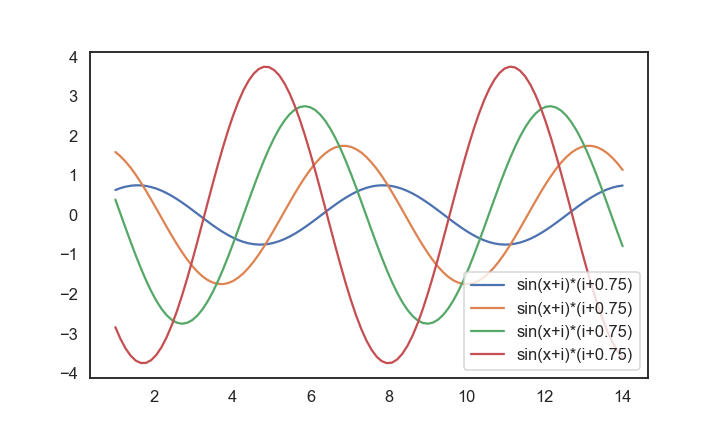
預設 matplotlib
drawPlot()
當設定完style之後的風格
sns.set_style('whitegrid')
drawPlot()
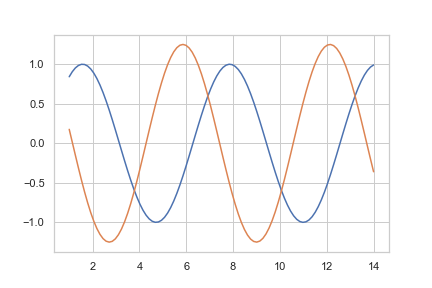
set_style預設有五種風格
sns.axes_style()
sns.set()
用於圖形大小的設置
sns.set_context('talk')
drawPlot()
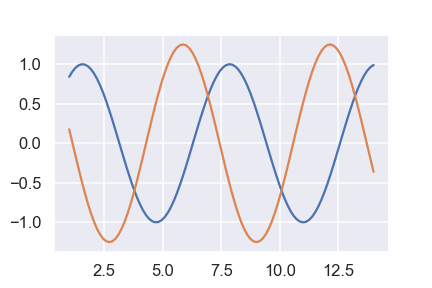
可以看到跟原本圖形的座標顯示大小不一樣。
set_context有四種風格
sns.plotting_context()
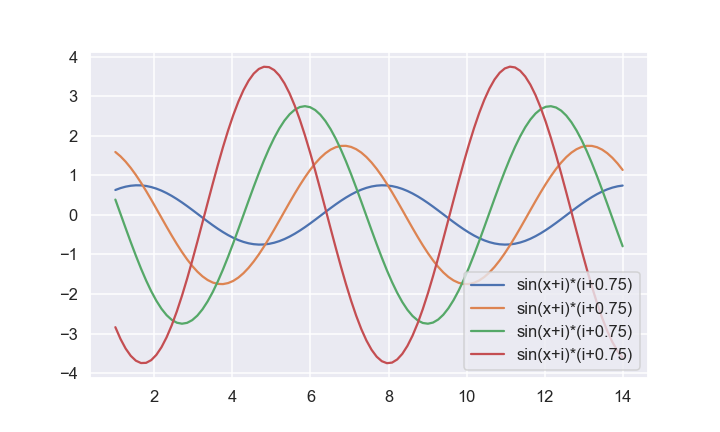
在當前這個圖表設定style。以下方法來顯示兩張圖表不一樣的地方
第一個先取得預設圖型
drawPlotFour()
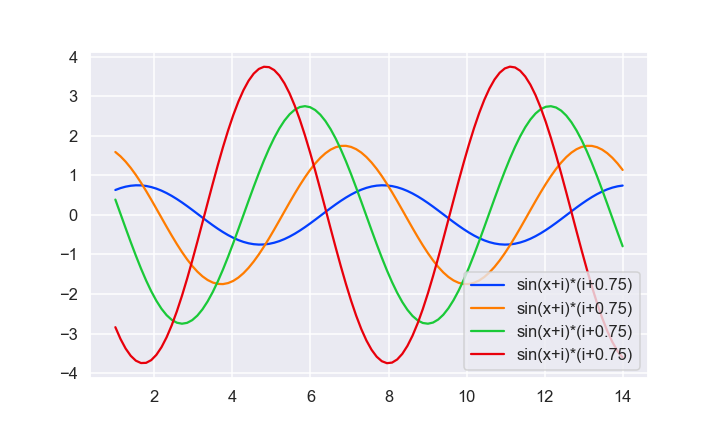
第二個使用with並且將style改掉
with sns.axes_style('white'):
    drawPlotFour()
可以看到第二張圖已經被改掉了,但是如果又再一次的呼叫drawPlotFour()是不會改style
sns.palplot(sns.color_palette())

可以看到上面四條線的顏色就是按照調色盤的顏色依序做配對,當超過調色盤數量的顏色時,會從第一個開始循環使用。
sns.set_palette(sns.color_palette('bright'))
畫出來的線條,顏色會比之前亮
sns.color_palette([(0.45,0.72,0),(0.22,0.34,0),(0.62,1,0.32)]) # 輸入rgb
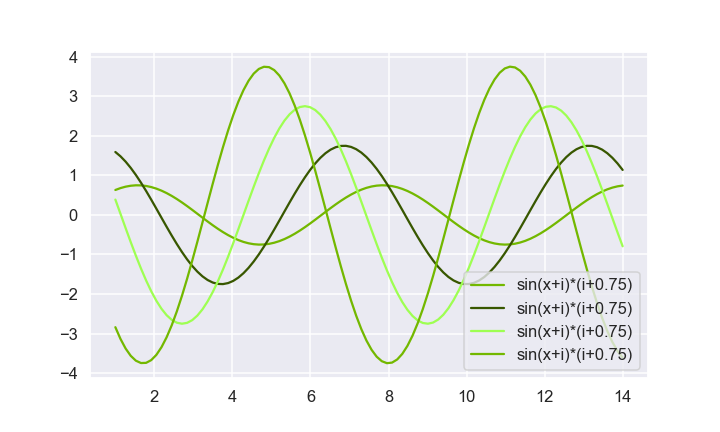
因為只有設置3個顏色,所以會有兩條重複的顏色。


 iThome鐵人賽