import pandas as pd
from sklearn.model_selection import train_test_split
from sklearn.linear_model import LogisticRegression
from sklearn import preprocessing
from sklearn.metrics import accuracy_score, confusion_matrix
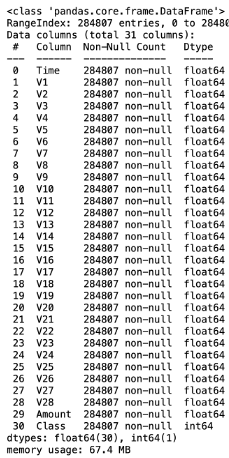
這是一筆信用卡公司收集某一年歐洲持卡人以信用卡進行的交易,共有284,807筆資料,其中有492筆資料為詐欺犯罪的行為(為高度不平衡資料),資料中每個欄位是由PCA獲得的主成份。
df = pd.read_csv('creditcard.csv')
df.info()
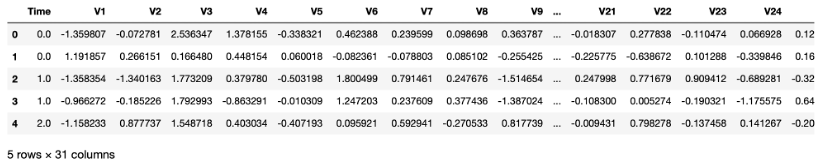
df.head()
sum(df.duplicated())                  # 顯示樣本有1081筆重複的樣本
df.drop_duplicates(inplace=True)      # 刪除重複樣本
df.drop('Time', axis=1, inplace=True) # 刪除用不到的欄位
X = df.iloc[:,df.columns != 'Class']
y = df.Class
X_train, X_test, y_train, y_test = train_test_split(X, y, test_size=0.20, random_state=5, stratify=y)
scaler = preprocessing.StandardScaler().fit(X_train)
X_train_scaled = scaler.transform(X_train)
model = LogisticRegression()                     # 建立模型
model.fit(X_train_scaled, y_train)               # 訓練模型
train_acc = model.score(X_train_scaled, y_train)
print("The Accuracy for Training Set is {}".format(train_acc*100))

y_pred = model.predict(scaler.transform(X_test))
test_acc = accuracy_score(y_test, y_pred)
print("The Accuracy for Test Set is {}".format(test_acc*100))

cm = confusion_matrix(y_test,y_pred)
print(cm)
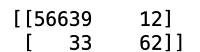
常常在分類的問題中,很少會有在訓練集與測試集都得到那麼高的準確率,或許是因為這筆資料最適合的模型剛好就是邏輯斯迴歸模型,因此可以得到這麼好結果。而針對這種高度不平衡的資料(imbalanced data)有時會被高準確度蒙蔽,以為模型配飾的很好,但其實模型可能只是將所有結果分類到特定的類別就可以得到高準確度,此時可以利用混淆矩陣或ROC曲線的線下面積來觀察分類的情況較為適合。
資料來源:Kaggle


 iThome鐵人賽